


Digitizing Maps Showing Locations of Flint's Lead Pipes
By Alex Alsup on January 30, 2016
Ari Shapiro from NPR posted a photo on Instagram with the comment: "These are the maps that will help people in #flint figure out which pipes are made of lead and need to be replaced."
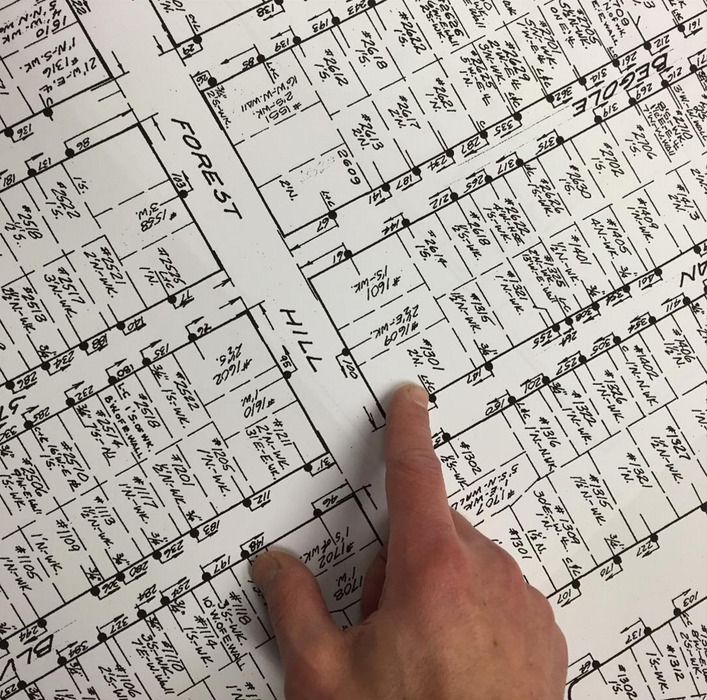
At first glance it looks like an old Sanborn map, but we don't think it is. Perhaps it's some kind of engineering map drawn up by Flint itself. As best we understand, no digitized version of the map exists. But if the people of Flint are to understand exposure, impact, and removal needs, they'll need to digitize that data and match it up with other existing information, like which houses are occupied.
I took a stab at digitizing just the bit of the map captured in Ari's photo using LOVELAND's Site Control software. That's what it's designed for -- capturing parcel based data in an updatable, sharable format, with multiple data sources overlaid. So if we can get at those Sanborn maps, we can digitize the rest for the city.
Below is the map I made digitizing the data in Ari's image. In Ari's photo he points to a notation on a property that reads "L+C". I assume this refers to the type of pipes connected to the property, though I'm not certain -- maybe "Lead + Copper"? I've highlighted in red in this map the properties in Ari's photo that had the "L+C" notation.
Click any parcel to see the data from the Sanborn map. If you click the "Basic" tab on a property, you'll see imagery of the property and ownership and assessment information.
If you have info on these maps, please let us know team@makeloveland.com
Sample Flint Sanborn Map Digitized in Site Control