


White Labels & You
By Nick on April 21, 2020 · How-To
Hey all, this is Nick with Landgrid. I thought I’d do a quick blog post to talk a little bit about how excited we are to be able to offer white labeling services to our clients, and explain why we’re so stoked.
To Start:
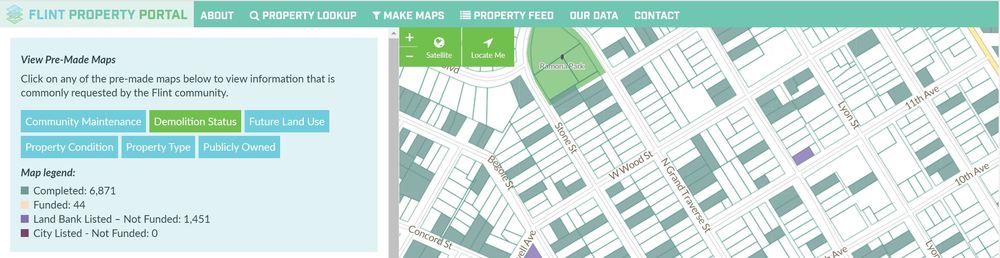
You already know that Loveland makes fantastic GIS software for visualizing and managing property information out of the box via our flagship platform, Landgrid.com. However, many of our most powerful projects have customized the look and feel of our software to the exact needs of a business, government, or community development organization (the Flint Property Portal is a great example).
In the past these projects were one-offs, meaning that the cool features that we made for one client we couldn’t easily replicate for others. What we have now for the first time is the ability to create these for pretty much any Enterprise customer who would like one, at scale.
What this means:
No matter what you’re using our platform and/or data for, we can customize a site that’ll make it all about you and your needs. We can change the look and feel of the site visually, as well as highlighting the information you need and removing anything you don’t. If you’ve ever thought “I wish I could do X thing with this data”, the time has come - now you can. I think you’ll agree, that’s pretty compelling.
So, what exactly is a white label? Glad you asked, and here’s a handy graphic to help explain.
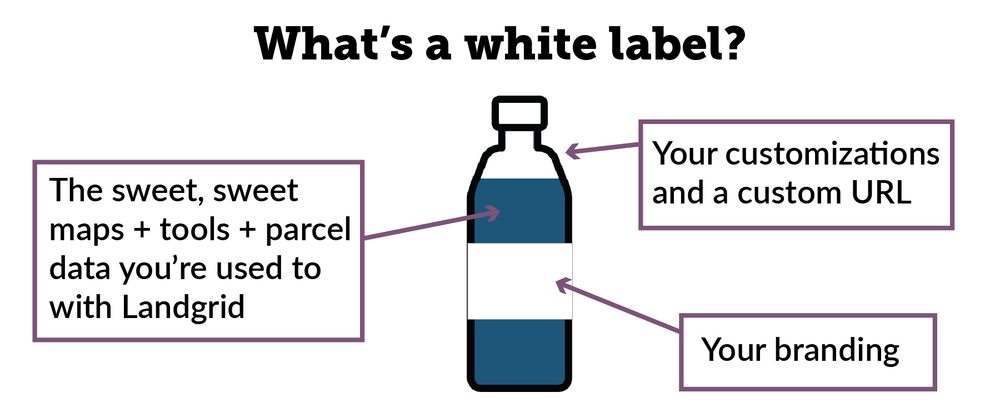
As you can probably gather, white labeling is a broad concept and can apply to a lot of potential use cases, which is one of the reasons I think it’s so cool. For existing clients, white labeling can really supercharge the impact, utility, and visibility of their work with Landgrid; in addition, I also anticipate a whole swath of potential new customers for whom we suddenly become relevant and attractive.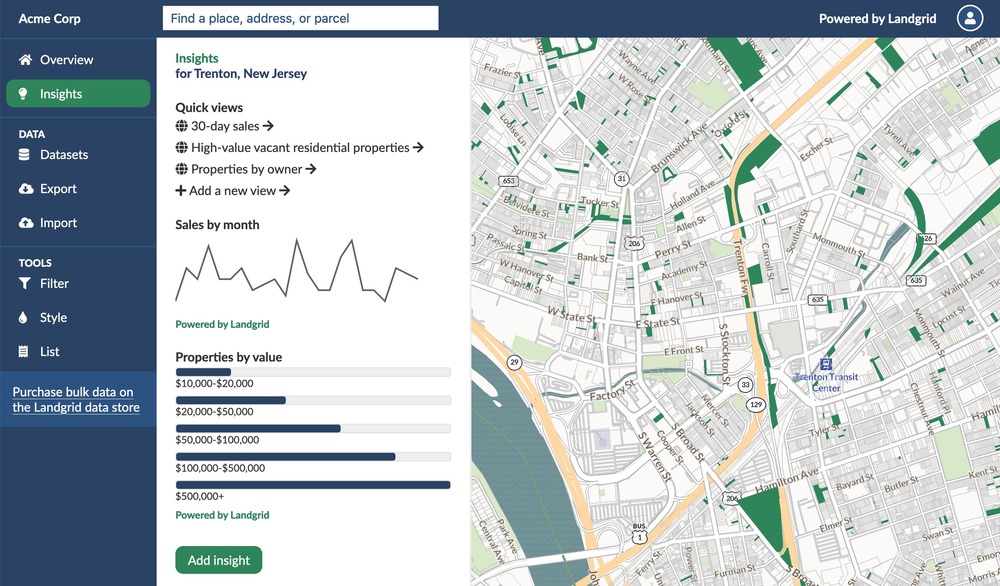
Rather than continuing in generalities, I thought I’d lay out some specific examples of things that white labeling now allows us to get into via some friendly hypotheticals. If any of these spark an idea for you, your business, or someone you know, please check out our revamped Enterprise page and shoot me an email at enterprise@landgrid.com. As always, we’re more than happy to talk through the details as they relate to you specifically - we're a friendly bunch and love to take customers all the way from concept to finished product.
Real Estate
Scenario 1
You’re a real estate company with a portfolio of properties which you hold and/or manage. Your investors want to be able to quickly and easily see which properties are owned, status updates as they occur, and track potential future investments.
Solution
With a white labeled site, you can give your investors access to a private site at a URL of your choosing, with your companies’ branding, that color-codes properties by ownership or as potential leads. Property managers during their daily work or staff scoping out potential acquisitions use the Landgrid app to snap photos and make notes about properties, all of which shows up in real time on a customized field.
Scenario 2
You’re a realtor whose primary interest is in a specific region (or regions) of the country. You want the latest property transfer data as well as any other metrics you can get your hands on that will help you determine which properties to take on and how to market them.
Solution
We’re bulking up our customizations so that you could set up a white label solution that pulls the metrics you’re interested in onto an Insights dashboard. You could see the number and sales value of properties sold in an area over time, bookmark properties you want to check out, and set up a data integration so that other sales data you have access to flows into your Landgrid account automatically.
Scenario 3
You’re a real estate investor, and you specialize in certain types of properties (commercial, vacant lots, residential rehab, etc). You need access to data that will give you an edge on finding these properties before your competitors.
Solution
Here, we’d set up some customizations on an Insights dashboard that could flag properties that fit your criteria as soon as they become available, in addition to some premade maps that would (for example) color code vacant commercial structures as yellow, vacant residential structures as blue, etc. Using this information, you could either go out and visit them in person with our survey app, or use it as a starting point to do outreach to the owners of those properties or other research.
Land Bank
Scenario 4
You’re a land bank, and you need a way to track properties from abandonment and vacancy, through acquisition, all the way to sale and transfer to new owners. You have hundreds of these properties, and it’s becoming a huge hassle to keep track of them all and make sure you have the most current data for any given property!
Solution
First of all, if you were using a database software to track properties, we could integrate with that - so that changes you make there get reflected onto our map. If you were doing it more, let’s say, “old school” via paper or a simple spreadsheet, we would be happy to consult, design and set up a new workflow for you that uses Landgrid primarily, making far more efficient use of you and your staff’s time going forward.
Nonprofit/Government
Scenario 5
You’re concerned with the increasing number of tax delinquent properties in your area, and you need segmented data, as well as a way of tracking outreach to residents.
Solution
We could set you up with a custom site that would have a handful of premade maps: one highlighting tax delinquent properties, one highlighting properties that have had outreach (what, when, and status), and a handful of other premade maps showing things like valuation and transfers so that you can anticipate which areas to pay special attention to in the coming months.
Scenario 6
You're a municipal government looking for a user-friendly way to publicly show the various investments and projects being undertaken by the city, because you value transparency and open data.
Solution
We’d set up for you an attractive public-facing interface as well as the training needed for staff to input data; premade maps for each area (streetscape improvements, paving projects, tree planting, etc) could be created. All data could be integrated with an existing Open Data portal if it exists for easy resident download, and/or we could host those downloads on the white labeled site itself.
Academic
Scenario 7
You’re digitizing hard-copy historic data (Census, building records, sales data, photos, etc) and you need a platform to input this data and tie it to the current parcel. You want the final product to be available to other researchers in the future.
Solution
Rather than recreate the wheel, you can use a site with Landgrid’s parcels as a georeferenced base on which to append your data. This site can be used by any number of staff while digitizing to submit records, and once the project is complete, you could work with Landgrid staff to visualize the data in whatever way feels most compelling. Project leaders could view productivity stats for staff working on the project, review digitized records, and flag any in need of further review.
Philanthropic
Scenario 8
You want a dashboard that can track investments you’ve made in a given city, or nationwide. In addition, you want to be able to easily see specific information that might inform data-driven decisions around equitable funding, and identify existing gaps in the funding you provide.
Solution
We can create an attractive interface that you can use to generate needed metrics for funders quickly ("we have funded 20 projects in ZIP code XYZ, 3 of which were arts & culture grants, and invested $3m") on a map which can be private or public.