


See Seven Years of a Detroit Neighborhood Unfold
By Alex Alsup on April 14, 2015
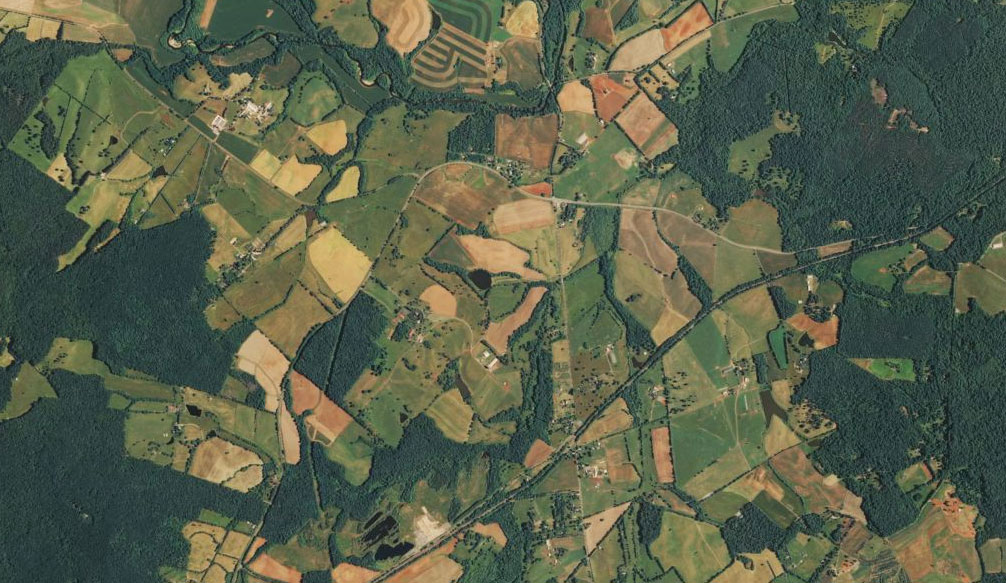
Drag the Slider Below to see the Spread of Vacant Homes in a Detroit Neighborhood


A Property Surveying Time Machine
The ability to drop in on almost any corner of America via Google Street View is an unprecedented and, we at LOVELAND Technologies think, under appreciated bit of magic. But it was the release of Street View's "Time Machine" feature last year that turned the magic of Street View into a full on superpower, letting you rewind and see a city's recent past.
By combining Street View's Time Machine with LOVELAND's suite of parcel mapping and surveying tools that let you collect and visualize lots of parcel data quickly, you can monitor a neighborhood, a city, or a whole country's change over time, trace its trajectory, find causes for growth or decline, and reveal problems before they metastasize. It's a powerful concoction. We tested it out in the Detroit neighborhood shown in the parcel map above.
The Experiment and The Tools
Over the weekend, I surveyed a 190 property area on Detroit's east side, just across the street from the shuttered Alexander Macomb Elementary School. I knew from Motor City Mapping (a project LOVELAND worked on in which we surveyed all 385,000 properties in Detroit) that the area was distressed and had a high vacancy rate, as the neighborhood at large does. What I didn't know, and wanted to try to find out, is:
- When did people start to leave the neighborhood, and are they leaving in greater numbers now, or in the past?
- What factors might have informed, or forced, their departure?
- What is the impact of all this vacancy on property values?

To figure this out, I surveyed the area in 2008, 2011, and 2013 (via Google Street View) and present day (April 2015) with surveyors in the field using the LOVELAND App*. For every parcel, I recorded whether there was a structure on the site, whether the structure appeared occupied, and, if a structure was present, whether it was fire damaged and to what extent. These are all pretty quick indicators of a Detroit neighborhood's overall health.
Unfortunately, Google's Street View API does not support access to Time Machine imagery, so for 2008 and 2011 I sat there like a goof, taking pictures of my computer screen with the LOVELAND App (pretending like I was out in the field surveying property) and collecting survey data. For 2013, which the Street View API does support, I contributed to LOVELAND's Great American Parcel Survey, and surveyed the 190 properties in a wonderfully speedy hour (an example of that survey process is animated below).

I used LOVELAND's Site Control platform to visualize data on each of the 190 properties in the neighborhood for each of the years surveyed. Site Control is LOVELAND's parcel mapping platform that gives you the tools to work with parcel data and build parcel maps anywhere in the country where we have coverage. I built a series of maps with Site Control that shows properties color coded as either vacant lots, occupied homes, or vacant homes. You can explore the maps for each year at the bottom of the post, and click parcels to see data and imagery for that year.
The Findings

The chart above shows the breakdown of occupied homes, vacant homes, and vacant lots for each year surveyed. The surge from 2008 to 2015 of between 41 and 46 vacant homes is shocking (ambiguity due to demolitions and properties with unclear occupancy status) but it's worth noting a perhaps less obvious number, too: In 2008 there were 62 vacant lots in this neighborhood. At some point, many of these properties likely had a single family home on them.
Detroit, of course, has been in decline for decades, but the financial crisis unleashed a new and virulent wave of devastation on the city that is still rumbling through with potent aftershocks. With Street View, which started collecting imagery at the very moment the 2008 financial crisis began, and LOVELAND's tools, we can see just how this latest collapse unfolded, and some of where it's heading. To return to the initial questions:
When did people start to leave the neighborhood, and are they leaving in greater numbers now or in the past?
The 2010 U.S. Census estimated there are 2.86 people per household in the census tract that contains this area. Using that as a guide, and knowing that we're only dealing with single family homes in this neighborhood, we can estimate population for each of the years surveyed. Those estimates are represented in the graph below.

Clearly the steepest population drop occurred between 2008 and 2011. Though the slope is still downward from 2011 to 2015, it is trending towards a tapering off, or at least a deceleration. So, it seems safe to say that the most dramatic population loss occurred in the year or two following the financial crisis.
What factors might have been informing, or forcing, residents' departure?
There are plenty of reasons one might have left Detroit just after the financial crisis -- jobs, crime, education (Alexander Macomb Elementary closed its doors in 2009, and certainly could have contributed a reason not to stay in the area), to name a few. One force unique to Detroit is tax foreclosure -- 62,000 properties in the city face foreclosure in 2015.
There has always been something of a chicken or the egg dynamic with tax foreclosure: Do vacant properties fall to tax foreclosure because their former residents left and are no longer paying property taxes? Or do residents become unable to pay property taxes, and wind up leaving once they've lost their homes to foreclosure, or perhaps are forced from their homes by speculators?
By surveying tax foreclosed properties both before and after their foreclosure, as we did here via Street View, we can see the order of operations, and develop a more informed understanding of how tax foreclosure and vacancy interact. (Of course, this should be tested across a larger sample size, but the results are revealing at this small scale.)
In 2012, thirteen properties from the surveyed neighborhood were tax foreclosed. As the graph below shows, vacancy amongst those thirteen properties cropped up both before and after their foreclosure, and in equal number.
By 2011, four homes that were occupied in 2008 had gone vacant -- a year before the actual foreclosure date (there is a three year fuse on tax foreclosure, so presumably residents may have known it was coming). By 2013, one year after foreclosure, another three homes were added to the vacancy list. The four homes that remain occupied did so in an interesting way -- they were all foreclosed, and all four passed through the foreclosure auction without a bid. Today, all four remain occupied and are owned by the City of Detroit.
Though this is a small sample size, it rings true with our experience monitoring tax foreclosure across the city: Tax foreclosure is both a cause, and symptom, of vacant properties in Detroit. In what proportion this is the case would be very valuable to examine across a number of different kinds of neighborhoods.

Property speculation, the practice of bidding on auction properties from afar in expectation that they will be worth more later with no effort for the buyer, does not appear to have been the cause of any vacancy in this neighborhood: Of the 34 properties in the area that went to foreclosure auctions between 2011 and 2014, only one property sold -- for $500.
26 of those 34 foreclosure properties are now vacant homes owned by the City of Detroit -- properties that will likely need to be demolished at a priced tag of $10,000 - $15,000 per home.
What is the impact of all this vacancy on property values?
Detroit Assessor's data does not show a property sale in this neighborhood since the $500 purchase of a foreclosed property in 2013. Another 15 properties in the area face tax foreclosure in 2015, three of which are occupied. Of the 66 occupied homes that remain, 23 are next door to, or back up to, a vacant structure, putting these properties at increased risk of fire damage among other hazards of being in close proximity to vacant properties.
Below is a scatterplot of available sales data for properties in the survey area (note this graphic only includes the latest sale, not ALL sales), with trendlines showing the weight of property sales trajectory.
If foreclosure begets more vacancy, and vacancy leads to more foreclosure, a vicious cycle driving down property values will continue.

Conclusions
We're only scratching the surface of what time series survey data can do when collected at scale, at the parcel level, and merged with governmental data like foreclosure information, tax assessments, and more. The flip side of surveying Detroit's decline is looking at the rapid development of growing cities. Across the country there is a wealth of information contained in the archive that is Google Street View, and with LOVELAND's tools and ability to organize and present property data, there are insights close at hand.
Explore the parcel maps for each of the years surveyed, below, with Site Control.
Written and Assembled by Alex Alsup
*A note on the survey methodology: A street level assessment of properties is revealing when it comes to occupancy, but not 100% foolproof. If you happen to know the neighborhood and see any assessments that you think are incorrect, let us know at team@makeloveland.com