By Raven Visser
on March 19, 2020
· How-To
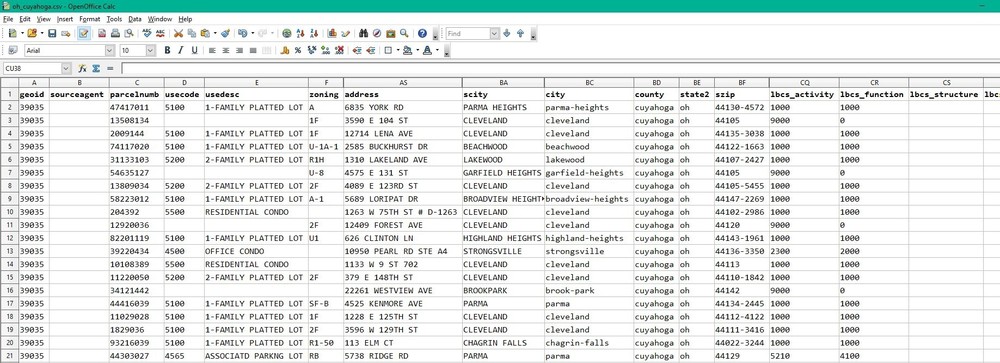
While browsing Landgrid's data, you may have encountered fields like "lbcs_activity" and "lbcs_function", but their values are just 4-digit numbers. What exactly do those fields mean? Let's take a quick look!
The Land-Based Classification System (LBCS) is a method devised by the American Planning Association to describe how the land of an individual parcel is used. It encodes land use across five dimensions (activity, function, structure, site, and ownership). These codes are 4-digit numbers, with the first digit denoting the broadest category, and each successive digit describing the parcel in more detail.
We focus primarily on the "lbcs_activity" and "lbcs_function" dimensions because they make the most sense at the parcel level. Activity describes the actual human activities that take place on the parcel, while function describes the broader economic or social use the parcel serves. For example, a parcel that is used as a parking lot for a school would have an "lbcs_activity" code of "5000" (for "Travel or movement activities"), but an "lbcs_function" code of "6000" (for "Education, public admin., health care, and institutional").
Most parcel data, however, does not use LBCS, and varies widely in how land use is classified (if that information is available at all). If there is any information pertaining to how a parcel is used, it usually takes the form of local zoning, land use, or tax assessors' codes. Because of this inconsistency, our LBCS classification work is done manually, county by county, matching each place's land use or zoning information to the nearest applicable LBCS code.
Currently, in Loveland's dataset of more than 144 million parcels, 54% of parcels have an LBCS code for function, and 45% of parcels have an LBCS code for activity. These percentages are increasing constantly as we add new places and fill in codes for existing ones. You can stay up to date on which places have LBCS data using the Landgrid coverage report.
We're working on implementing additional data fields to provide text description in addition to the LBCS codes. This will do away with the need to cross-reference the 4-digit codes in Landgrid's data with the APA website's master list of codes for each dimension. We hope to have these fields operational sometime in 2020.
The main reason we spend time implementing LBCS in our dataset is its universality. Local zoning, land use, or assessors' codes are still visible on parcels which have that data (usually in the "zoning", "zoning_description", "usecode", or "usedesc" fields, and sometimes in custom fields). But while there is variability from county to county what a zoning value of “101” or “R-1” is, an "lbcs_activity" value of "1000" always means "Residential activities".
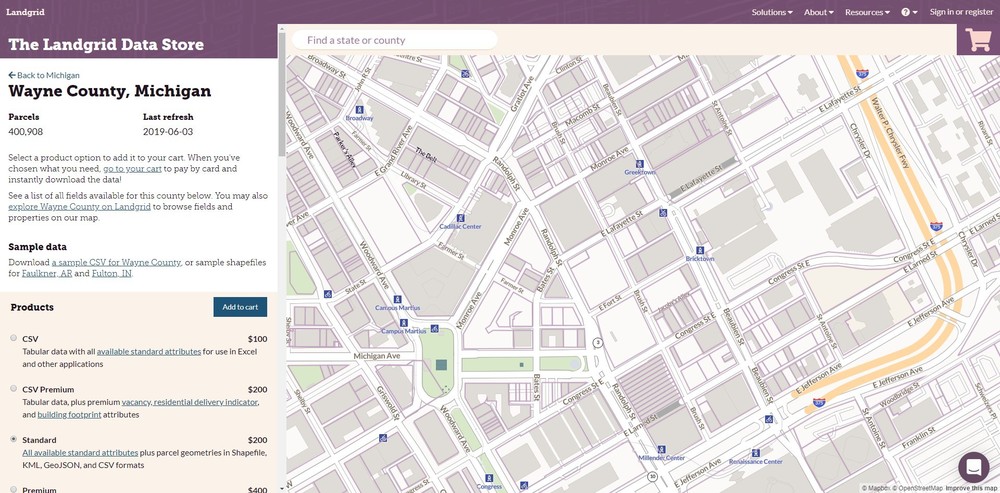
This consistency means users of Landgrid's data and the mapping platform can perform queries to find trends across the dataset, or to count certain types of parcels. For instance, a regional business specializing in agricultural equipment could download the data for surrounding counties from the Landgrid data store, and query that data to find the number of parcels in each county with an "lbcs_activity" code in the range 8000-8999, for "natural resources-related activities".This could give a broad overview of places where agricultural activity is more prevalent and could help with focusing sales and marketing efforts where they are more likely to succeed.
Likewise, finding and mapping all the residential parcels in a city could help with understanding and tracking the spread of disease outbreaks like the current COVID-19 pandemic. If you are a local government or a fellow mapping and data company that could use parcel data to push forward your study, outreach efforts and research on COVID-19, or if you have questions about LBCS in general, please contact the Landgrid team at team@landgrid.com, or check out the parcel data FAQ.
Ray Visser
Team Loveland
By Sahana Murthy
on January 9, 2020
· How-To
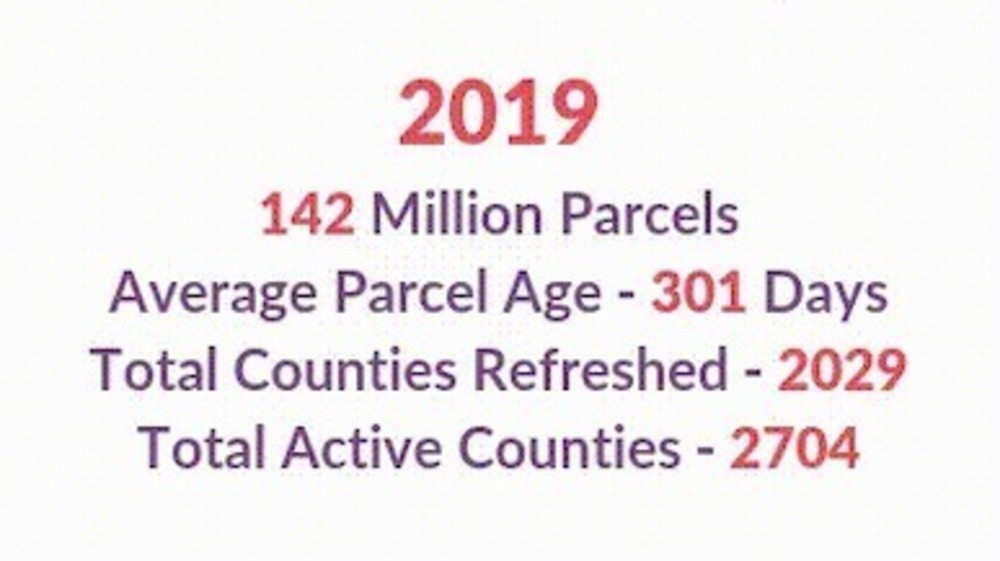
As of end of 2019, Loveland has aggregated 142 million parcels nationwide, all of which is meticulously mapped on the Landgrid Mapping Platform.
Not just that:
We refreshed - 2029 counties
We have a total of - 2704 counties &
Best of all, our total average parcel age/currency is under a year right now!
Oh and how can I forget - We added the coveted USPS residential and vacancy indicators to our data.
But enough about the data we have!
Let’s talk about YOUR Data!!!
In today’s time, we know that everyone has & wants to work with their own datasets. You’ve spent years perhaps collecting the property data that you use for your day to day work - whether you are a county, Landbank, university, mapping company or operate in real estate,
As a data company, we value ALL data.
So, Bring your own data to us and we will manage it and put it all up in one central location - Be it your own massive or small property dataset, mortgage data , census tract data or data that you may have collected using property & land surveys.
Landgrid Enterprise - Finally, all of your organization’s property data in one place, fully integrated with the software you need to do your work.
https://landgrid.com/enterprise
No matter the size & scale of your data - leave it to the Loveland team to manage & import it for you.
Doesn’t matter how your data is structured - whether its in one consolidated DB or in multiple siloes.
We can handle it. We will clean it, standardize it, even geocode it if necessary and add it on to the Landgrid platform under your account.
And voila --- you & your entire can visualize your data, build beautiful color coded maps and augment your data with unlimited land surveys straight out of your Enterprise account.
Couple that with custom capabilities and you have the dream property management solution that you never knew existed.
What do we mean by custom solutions:
Could be anything ranging from as small as :
- custom reports
- to custom filters
- to custom data stats derived specifically for you, tailored to your analytic needs
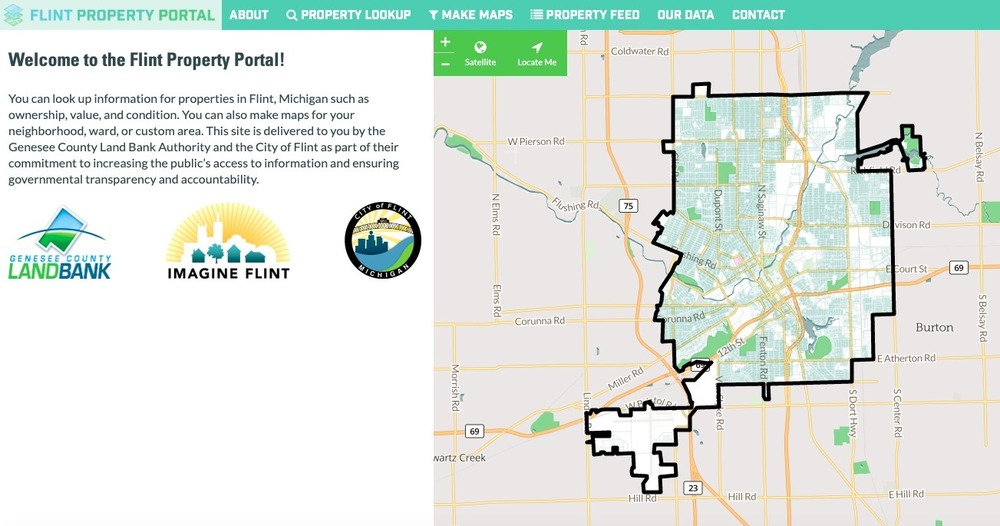
- to an entirely custom site built just for you with your branding with embedded & interactive maps. Here’s an example of a made from scratch custom site that we built in partnership with the City of Flint & the Genessee county - https://flintpropertyportal.com/
Sky’s the limit.
Don’t worry about the scale of your project either.
Got an idea or need for an easy to use parcel data solution (No prior GIS experience required)???
Email us at enterprise@landgrid.com .
We can do a quick demo and get you a sense of what your solution could be - tailored just you.
Doesn’t get better than this.
Lets handle your property data for you and make your life easy! How’s that for a 2020 resolution???
We look forward to hearing from you!
Enterprise Team!
Sahana Murthy
By Sahana Murthy
on September 19, 2019
· How-To
Howdy people of Landgrid & soon to be people of Landgrid!
If you have been following us these past few months, you know that we have been adding lots of improvements & new functionality to our suite of products.
Our most recent updates were the USPS - Vacancy & residential data that we added both to our bulk parcel dataset & to our Landgrid Mapping Platform.
Along the lines of making our platform better & easier to use & navigate, we recently conducted a UX study with a host of new users, power users & GIS users to understand how usable our product is.
A direct result of that are the new help tools to navigate & manage your projects better on the Landgrid platform. We have always had help tools & documentation on our platform.
But with these tooltips, we want to take things a step further to make your experience go smoother on the platform. We essentially want to make sure that you have the tools you need to make the most out of our fully loaded site & mainly so you never feel lost on how to use the platform.
The best thing about these help tools are that they are available to you, at all times on demand! You can toggle to turn them on when you need help navigating the site & turn them when you don’t.
Apart from the help tools, we have added some other functionality into the platform that are also a direct result of us listening to our customers. We took many of your requests and incorporated some of there here. I know there are many more requests & rest assured - We will get to them & add those to our product roadmap in the coming months.
So here’s a quick snapshot into everything that we have added to the platform to make it more usable:
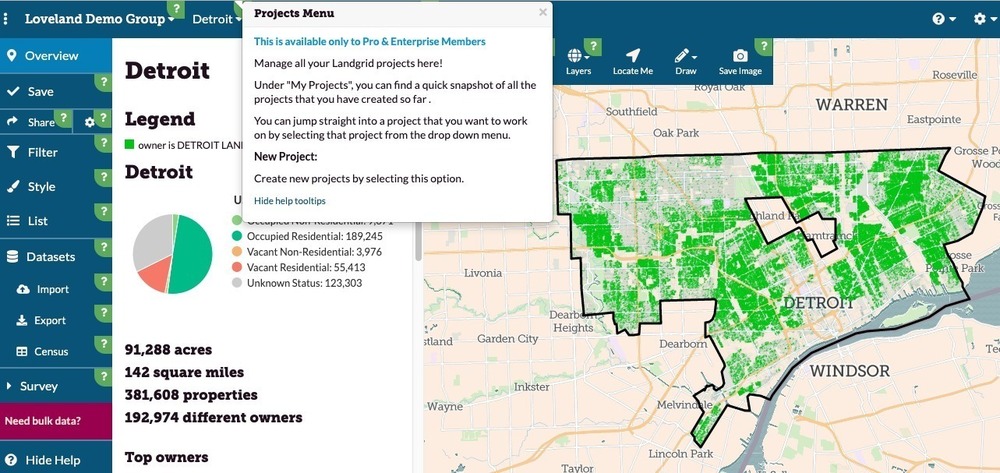
1. Onboarding Tooltips:
- To turn on tooltips, you can select “Show Help” on the left hand panel or under the “?” icon drop down and it will instantly bring up the tips for each of our many features.

- Click on the “?” on the tip and it will open up a window describing the feature to you, along with links to the relevant articles on our product documentation for a deeper dive into the feature.
- To turn the tooltips off, simple select “Hide Help” on the left hand panel, or on the tooltip window itself or under the “?” drop down.
- OR Simple press the escape key “esc” on your keyboard to exit the help tools.
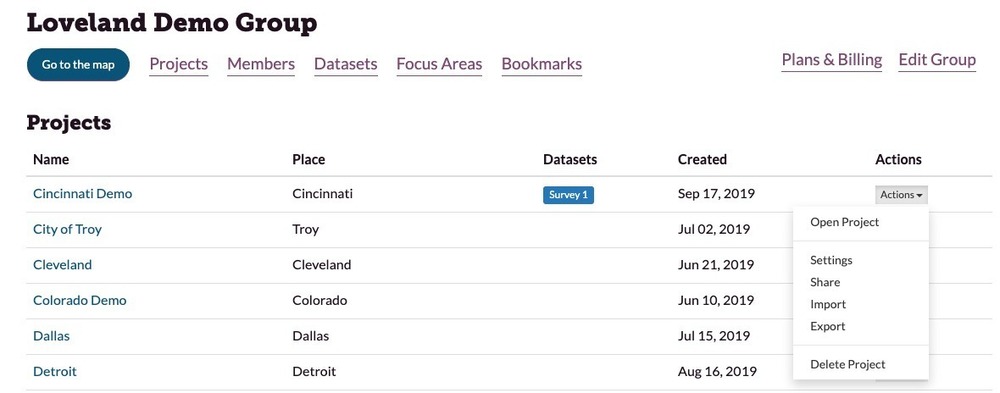
2. Project Settings:
- We heard you! We’ve had users asking for an easy way to manage & edit projects from one central location. You can now do that from your dashboard page.
- Select “Actions” drop down as shown below and you should be able to edit project settings, delete, import or export straight from the Dashboard.
- We also added “Date Created” and datasets associated with your project to your dashboard. So now you can see all the details that you need to know about your projects right here
3. Printable PDF’s of parcel page & attributes:
- We work with a lot of landbanks & municipalities and they have been asking us to build a way to print individual parcel records or survey records as PDF’s.
- And now its available on Landgrid.com!
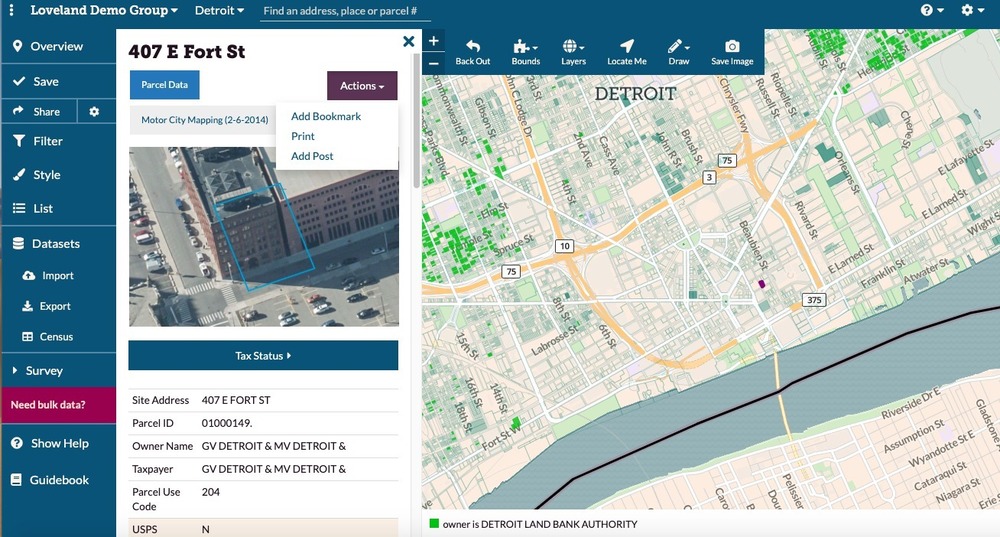
- How to access it, you ask? Easy - Navigate & zoom into the parcel you want to print.
- When the parcel page loads up, click on the “Actions” dropdown and you will see 3 options there:
- Bookmark - Which is now part of the dropdown.
- Print - To print the entire parcel record as a PDF
- Add Post - If your project is part of a survey, you can use the “Add Post” function to update the information for this parcel.
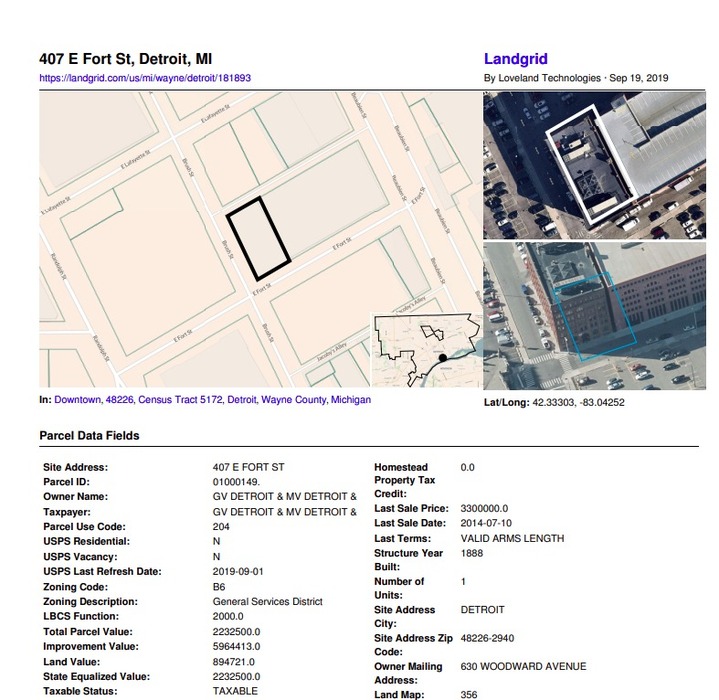
The resulting Parcel PDF looks like this:
4. Few other improvements:
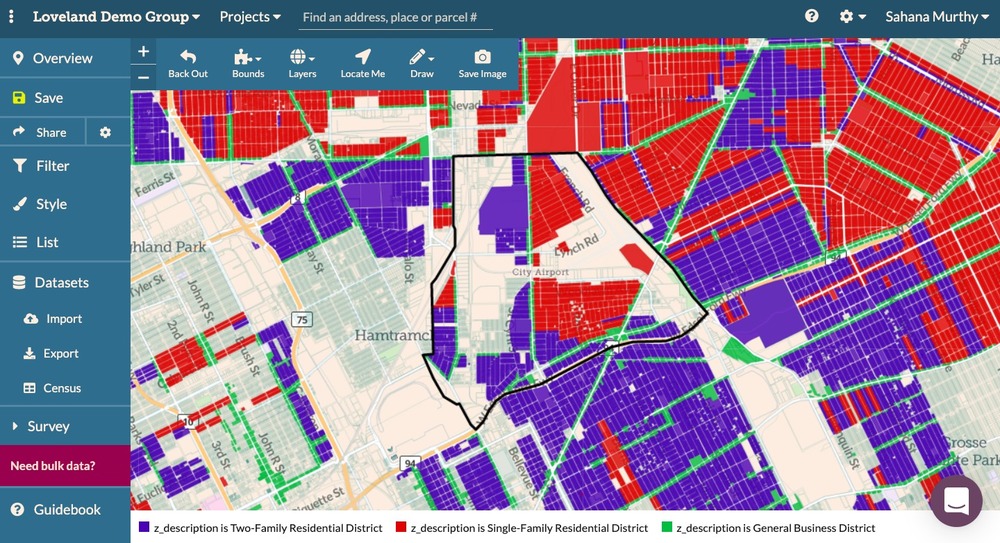
- We are in the process of adding building footprints to our data & as a map layer on our platform. We want to give you a teaser of what that would look like. For Pro & above users, go to “Layers” & select Ohio Buildings and you can see the building footprints render on the map. Soon we will have this available nationwide.
- “Esc” key can be used to turn off some of our other features as well - like the draw & measure tool. This was a request from one of our users & we made it happen.
- Better accessibility on the platform - Turning on & off of layers & bounds is more intuitive & usable now.
Well… That’s a lot of work & improvements from our team. Kudos to our amazing CTO Larry Sheradon & our data team for keeping us on our toes & making sure that we are constantly improving!
We are not done yet! There is more coming in 2019 & stay tuned with us to learn more!
By Sahana Murthy
on July 16, 2019
· How-To
This year Loveland has seen many changes and milestones. All of which we are so proud of.
We changed our site from makeloveland.com & platform from sitecontrol.us to Landgrid.com. Our suite of products now sit under the umbrella of the Landgrid mapping platform & Landgrid data. We launched our nationwide parcel dataset this year. We are constantly working on refreshing our data and will soon be close to an average parcel age of under a year!
But through all this, the one thing that hasn’t changed is the core essence of our mapping platform that literally provides the American land grid in a beautiful, GIS interface to everyone.
Of course, the interface has changed & gotten better over the years but our roots have remained the same. Helping individuals all over the country in discovering parcel level information in their region in an easy to use, spatial map interface! At the core of it is the Landgrid Pro solution that allows people like you and me to make maps, color code them, filter them, conduct land surveys and generally look up parcels anywhere in the country.
For someone like me who's looking to buy a home soon, this is the ideal tool. Within minutes I can look up properties that I would like to pursue, gauge what a neighborhood is like, who the top owners are in my county and find relevant census information for my location.
You can experience this tool too by simply signing up for Landgrid Pro or Landgrid Free.
Our free version will give you a taste of what we offer. But the Pro provides you with limitless functionality & features all for $10/month or discounted at $100/year.
Soon, you will be on your way to making beautiful color coded maps & surveys.
Here’s a quick snapshot of all you get with Pro:
- Unlimited Maps - Create as many beautiful maps and import as much data as you want.
- Import and export- Import & geocode your own data to parcels. Once you are done with your map, export your data as a CSV or shapefile or KML.
- Bookmarking - Bookmark properties that you find interesting by clicking the “+” button next to the address.
- Focus Area - Create a custom boundary on your map by drawing a focus area.
- Style & share - Style your data to create beautiful parcel maps, then embed or share your map with others.
- Measuring tool - Use our slick measuring tool to measure distances, areas and acreage. No more guessing!
- Multiple Layers - Add multiple layers like FEMA flood hazard or land cover to your map in addition to your base layers.
- Census Data - Quickly look up and get insight into relevant census data in your location. Can’t get easier than that!
- Unlimited Surveys - Create an unlimited number of land surveys using our survey editor. The editor comes pre built with questions if you want them but you can also generate your own survey questions to meet your project needs.
Phew… We are not yet done! There is more to Pro like the ability to filter your data to get deeper insights.
Still not sure -- Check out our tutorial videos on our Youtube channel. They will help you understand every facet of the Pro featureset. You can see how easy, simple & user friendly this tool really is.
No GIS experience required. I should know - I have no GIS experience too but I was able to make a map in just a few minutes after getting set up. Try for yourself & let me know what you think at sahana@landgrid.com.
Sign up today and be on your way to making insightful, color coded parcel maps & surveys - https://landgrid.com/plans
- Sahana Murthy
GM, Loveland Technologies
"Your go-to source for all things parcel data!"