By Jerry Paffendorf
on March 24, 2020
· Announcements
Jerry from the Loveland team here with a post about a new report written by Greg Markus with Detroit Action Commonwealth, made with the assistance of our software and analysis by our team, and supported by a grant from The Sociological Initiatives Foundation.
See the report here: Looking Back at the 2017 Tax Foreclosure Auction: 2020 Report.
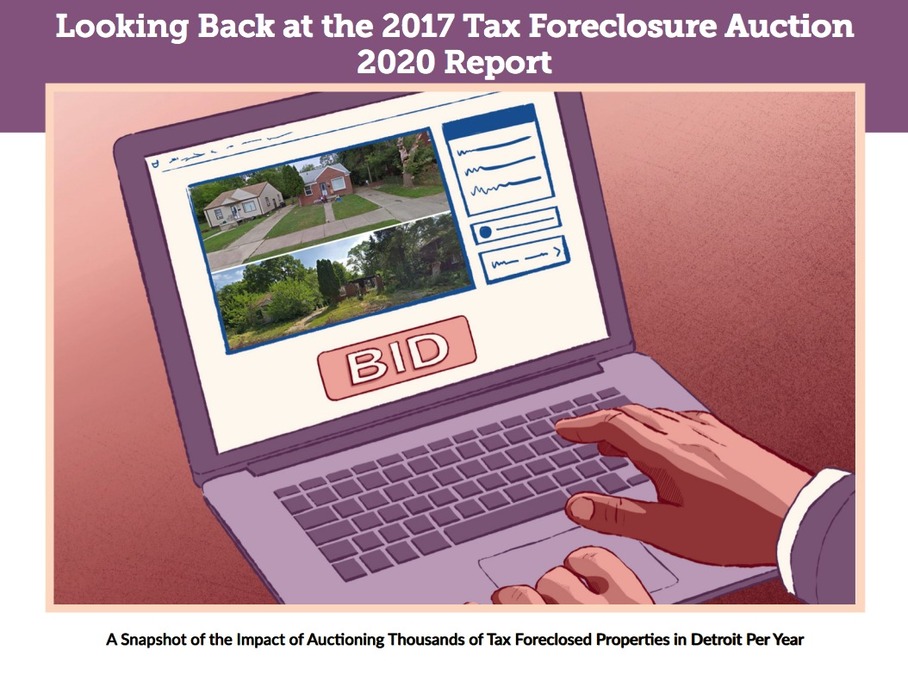
Those of you who have followed our work over time know that our headquarters is in Detroit, MI and that the intense property and land-use challenges of Detroit are more than close to our hearts. Over the years we have been involved in many projects to improve our shared understanding of the city and to advocate for better outcomes for Detroiters, Detroit neighborhoods, and Detroit property. The research isn’t always pretty, because the challenges aren’t pretty.
Chief among these challenges is an incredibly encumbered and fragile Detroit property tax base combined with Michigan’s incredibly aggressive and punitive tax foreclosure law that seizes and auctions properties that owe as little as $1 from 3 years ago. This combination has led to approximately 150,000 Detroit properties being foreclosed and auctioned since 2002 (that’s more than ⅓ of properties in the city), including more than 50,000 occupied homes, with the majority of tax foreclosures occurring since Detroit’s bankruptcy in 2013, though programs and payment plans have been chipping away at the auction numbers in recent years.
This tax foreclosure policy is a beast that has proven largely impenetrable to holistic review and systematic change, with dire consequences for the city’s landgrid, neighborhoods, and the people directly affected. While the law’s original intent was to quickly return abandoned property to productive re-use, over time it became a force for separating people from their homes at scale and distributing property ownership to distant buyers.
As you’ll see on the first page of the report, tax foreclosure has not been impervious to the coronavirus, and Wayne County has announced a moratorium on tax foreclosures in 2020, which was announced on the same day we were finalizing the report.
We hope that while things are on pause that the findings of this report — which include a look at how many properties in the 2017 auction were occupied and are occupied now; how many were occupied by renters who were not responsible for taxes but faced uncertainty and eviction after the property was sold; how many out-of-town buyers purchased the properties; how the new owners are keeping up on the taxes, and the impact on current occupancy — contribute to giving policymakers pause and help lead to changes that turn this annual ritual from an exercise in self-harm to a more thoughtful and humane process that consciously achieves shared goals for a better, happier, healthier city.
If our team or our software can be helpful to you in doing similar kinds of property research, whatever the issue you are exploring may be, contact us at team@landgrid.com.
Be healthy, be safe, everybody!
By Sahana Murthy
on March 11, 2020
· Announcements
|
Hi everyone. Jerry from Landgrid here.
Last Thursday we rolled out the new Landgrid Data Store where you can download clean, standardized parcel data and property information for any county in the country, simply and at a great price.
Fields include addresses, ownership, land use, assessment info, property boundaries and lot sizes... even vacancy and building data.
The store makes it easy to see exactly which fields are available for each county, when the data was last refreshed, and you can download a free sample before buying, so you’ll know exactly what you're getting. No mysteries here. And you get your file immediately.
We created the store because sometimes you just need to grab data for one or a few places that you can open and work with in your preferred software, whether that’s a spreadsheet program or a mapping tool.
I’m happy to say that on the very first day our very first customer sent us this testimonial:
"The convenience of being able to purchase data instantly from the Landgrid Parcel Data Store is unbeatable. The website was easy to use, and I was able to immediately download the data after submitting my payment. While everyone at Landgrid has always been very responsive to emails during purchase inquiries, this takes the convenience and speed of acquiring data to a new level."
- Bethany Berry, Landgrid Data Store Customer
Sometimes a breakthrough is just a change that makes things simpler. I think the new Landgrid Data Store is that kind of a breakthrough.
It perfectly compliments our parcel viewer, software, and state and nationwide data licenses to serve you parcel data however you need it, whenever you need it.
If you want to learn more about the store, how it works, and get instant answers to your questions, you can join me and my colleague Sahana for a short, 15-minute live demo webinar of the store at 3 PM ET today. Register here to save your spot: https://www.crowdcast.io/e/the-landgrid-parcel-data
Or just head to landgrid.com/store to check it out now.
All the best from the whole team!
|
|
|
Jerry Paffendorf
908-343-1981
CEO, LOVELAND Technologies
Landgrid.com
407 E Fort St, Suite 100
Detroit, MI 48226
By Sahana Murthy
on March 4, 2020
· Announcements
Welcome to the Landgrid Data Store – Your One-Stop Shop for all things parcel data!
Ever need to download data from Landgrid to use in another program?
You can now visit landgrid.com/store to purchase parcel data for any individual county in the country, either as a spreadsheet or as the full shapefile with parcel geometry, with the option to add premium fields including vacancy and building counts.
The process is very straightforward. You will see exactly which fields are available for a county and when it was last refreshed, you can download a data sample for that county, and all you have to do is pay by credit card to immediately download the data in your preferred format.

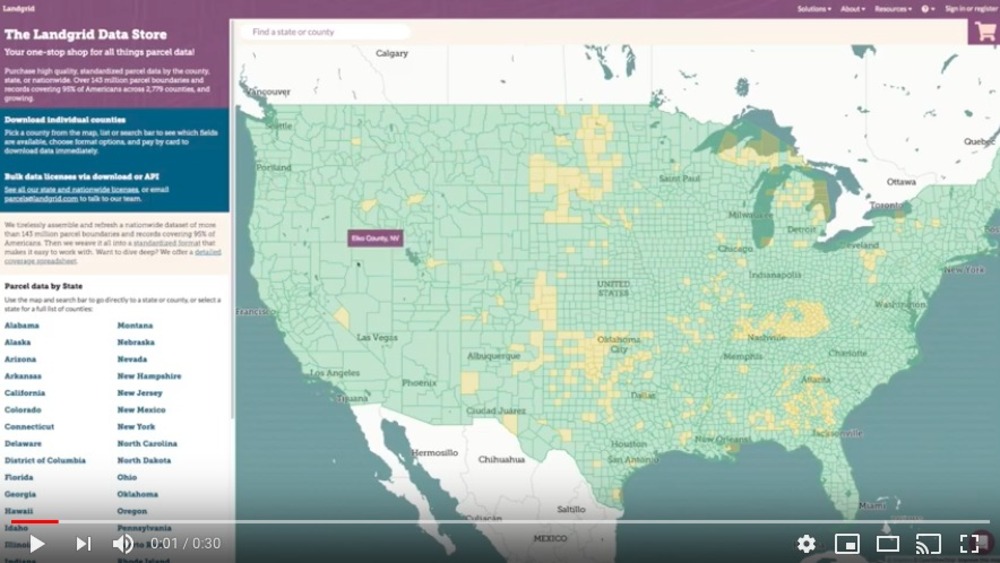
Here's a 30 second video tutorial on navigating & purchasing counties on the Landgrid data store -
With this launch, we have made it even easier for you to license our comprehensive parcel data from us - without any hassles or delays.
Here is the pricing:
CSV Data:
- $100 for a spreadsheet of all Standard property information in any county
- $200 for a county spreadsheet of all Premium property information, including vacancy and building counts
Shapefiles:
- $200 for a shapefile of all Standard property information and parcel geometry in any county
- $400 for a county shapefile of all Premium property information and parcel geometry, including vacancy and building counts
To take all of the mystery out of it, here’s exactly how the Landgrid Data Store experience works:
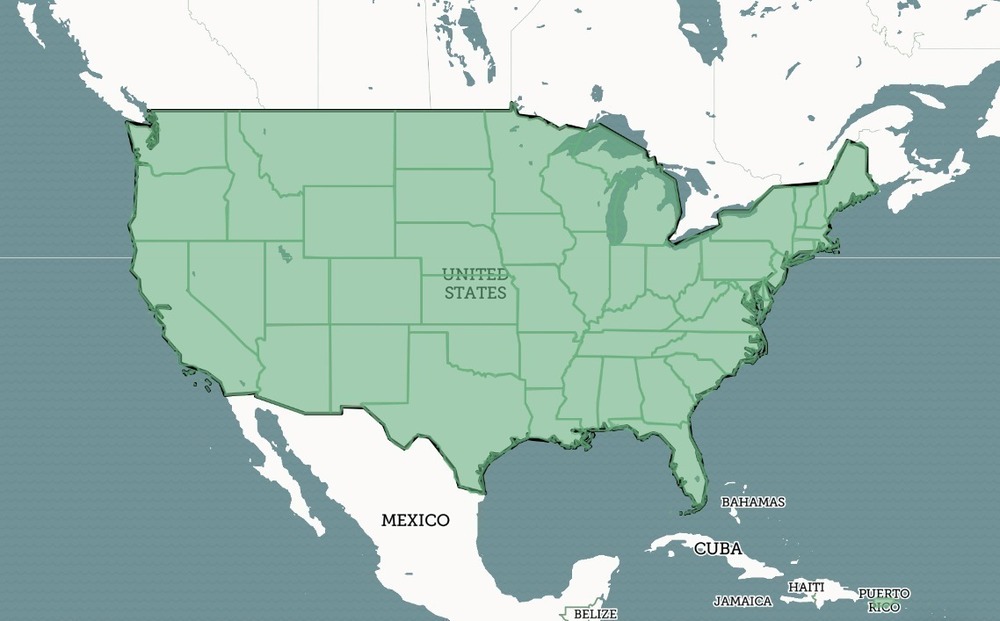
- Open the data store – landgrid.com/store. Here you will find our coverage map on the right. Green indicates places that we have data for and yellow indicates places that we are working on adding data for this year. You can also find our data dictionary of our standard schema and our coverage report for your review on the overview page. We encourage you to clearly assess the schema and the coverage report to ensure you know exactly what you would get from our data.
- On the overview tab, at the bottom you will find all the states listed. Based on the data you are looking for, you can select the state either here or from the coverage map.
- Once you select a state, you will find a list of all the counties in the state. When you are on the county page, make sure to download a “Sample” of the data for that county. We want to give you everything you need to make an informed decision before purchasing the data.
- Once you are convinced that you are getting what you need, select the counties & the data format you want and simply “Add to Cart”. Add a credit card and complete the transaction. Don’t worry. Our transactions are PCI compliant and your payment information remains secure.
- You will instantly receive a confirmation email with your order details and a link to download your files. Follow the link and voila, your parcel data files at your door step in no time at all. Please note that this link stays active for a month, so be sure to download your files before the link expires.
Eezy Peezy! All this without any hassles or delays.
A truly self-serve & seamless experience.
We believe in transparency and making this process super easy for you. So at every step of the way you will have enough information so you know exactly what you are getting from us.
While the data store is amazing for downloading county data, if you are looking for the entire state or nationwide data access with timely data updates, then please write to us at parcels@landgrid.com and we will get you set up with it in no time.
Our bulk data prices are listed on our parcels page. We offer API access as well.
This was our March update. The team has worked so hard on this store and we are so happy & proud to be able to provide our standardized parcel data to more folks at a low price in a smooth interface.
We will another update email coming to you soon about our nationwide land use code standardization and much more. Stay tuned with us!
Enjoy the data store and please give us your feedback on how we can improve your experience with it - team@landgrid.com
Happy Mapping!
By Matthew Klovski
on February 7, 2020
· Announcements
We’ve recently updated our basemap here at LandGrid and it’s a pretty big change from what we had online before!
Let’s take a dig through some of the different changes we’ve made to help improve your LandGrid experience.
The most noticeable change is that we now have a lighter base color, to improve parcel legibility, as well as making it easier to see at the state level what places are online or not online. This was one of the main bits of feedback we received on our previous basemap, and we’re happy to report we think this really improves the visibility in general. We’ve also improved the city hierarchy on the map to provide a bit more legibility in terms of population size, and also by which cities are shown at different zoom levels.
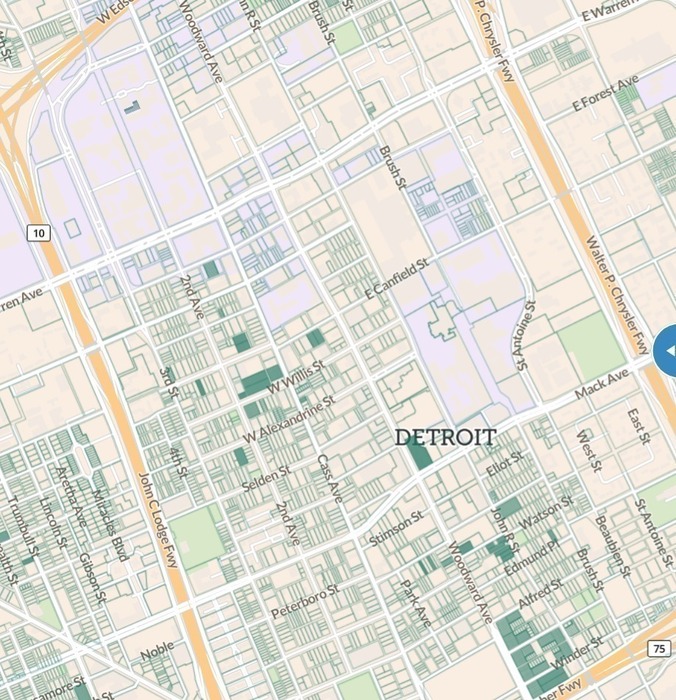
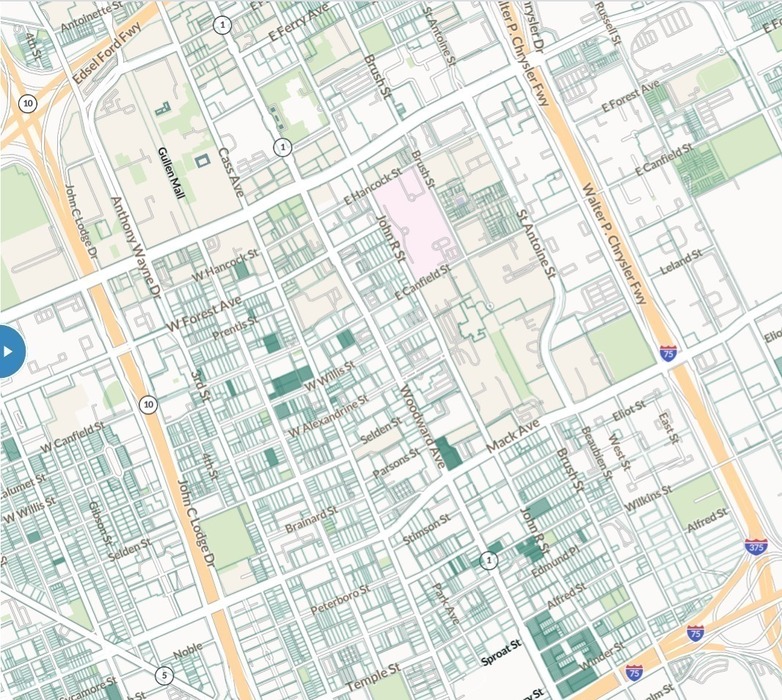
We’ve also changed the color coding of underlying land uses to subtler hues, especially in areas where there’s public lands or forests underneath the parcels. Here’s a side by side example of the same area within Midtown Detroit, using the old and new basemaps.
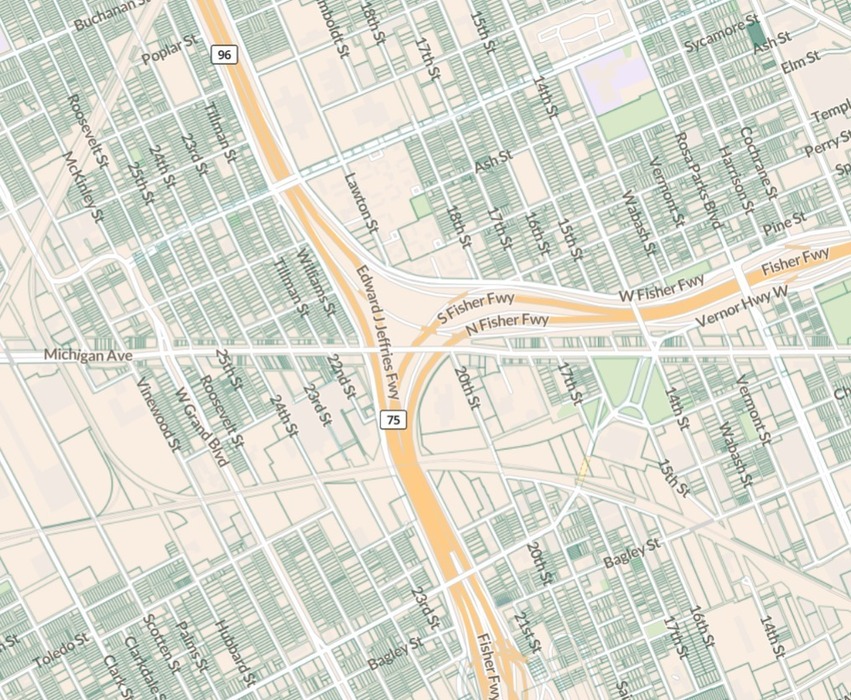
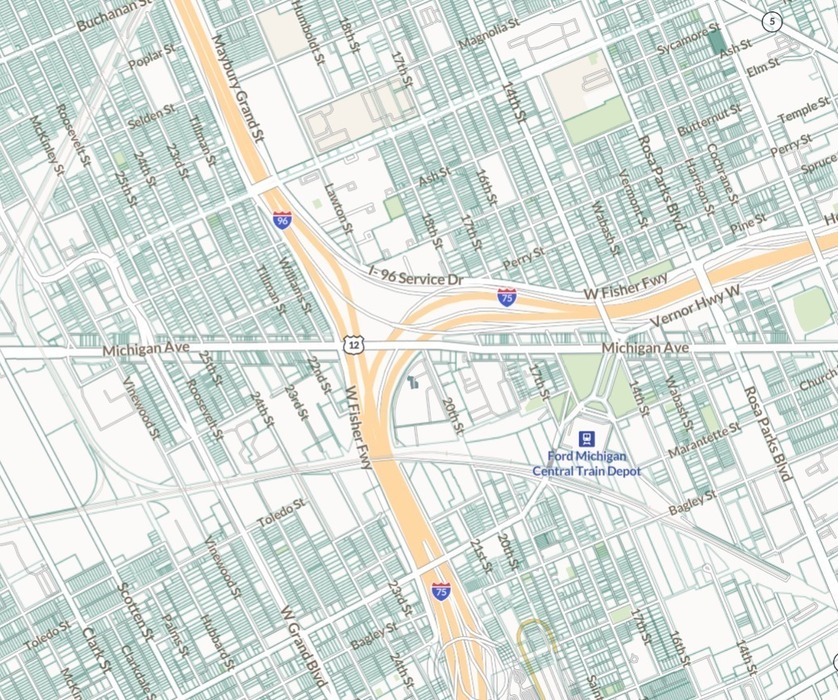
We’ve also updated the base streets layer provided by Mapbox in our map, in order to provide more up to date street names and layouts, in order to keep pace with rapid development in some areas. We’ve also changed the way we visualize highway and expressway icons, and now use the official icons for these types of roads. You can see the difference in these two screenshots from the catch-all boxes we had before.
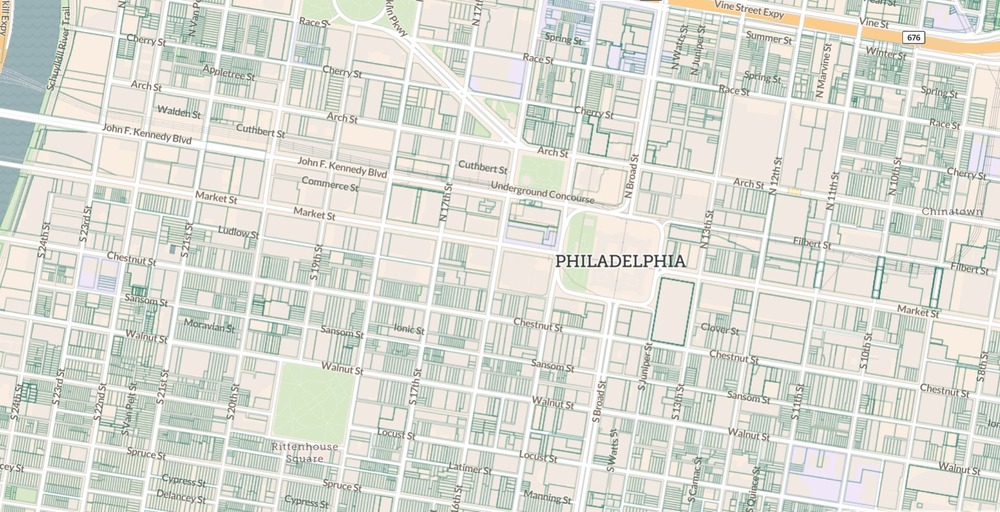
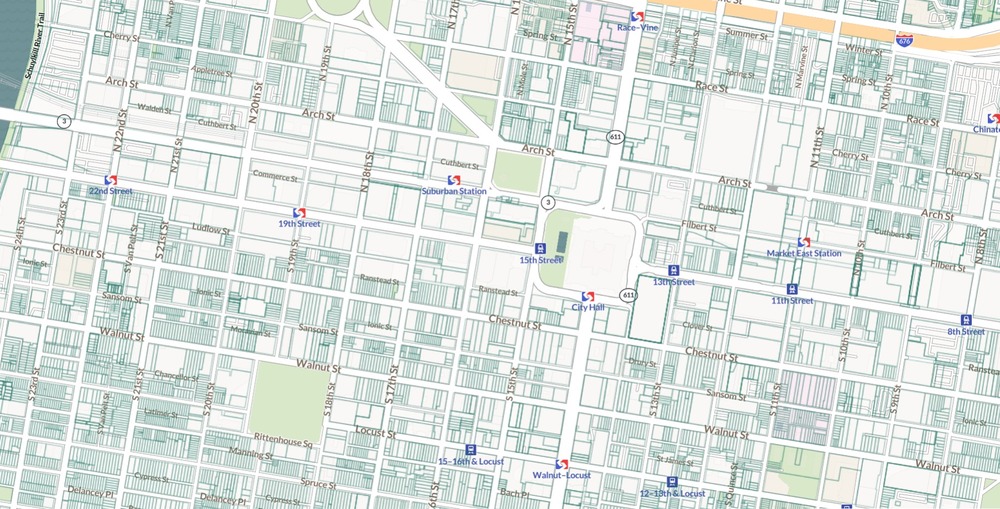
The final big change, and a really exciting one personally, is much better transit wayfinding and icon placement on the map. This includes custom transit icons in certain cities, and better airport icon indicators. Below is an example, using Center City Philadelphia and various SEPTA and trolley stops.
We hope you enjoy the new and improved basemap, happy mapping!
Matthew Klovski