By Sahana Murthy
on December 15, 2020
· Announcements
The holiday season is upon us and we will soon be entering the new year!
The Loveland team looked back at 2020 and all the improvements we have made this year to our parcel dataset and put those stats together into this nifty little report that we call the - "EOY - Parcel Data Report".

This report is a 1:1 comparison of our key parcel KPI's between Dec 2020 and Dec 2019.
And we couldn't be prouder of our team & product!
Here are a few snapshots from the report:
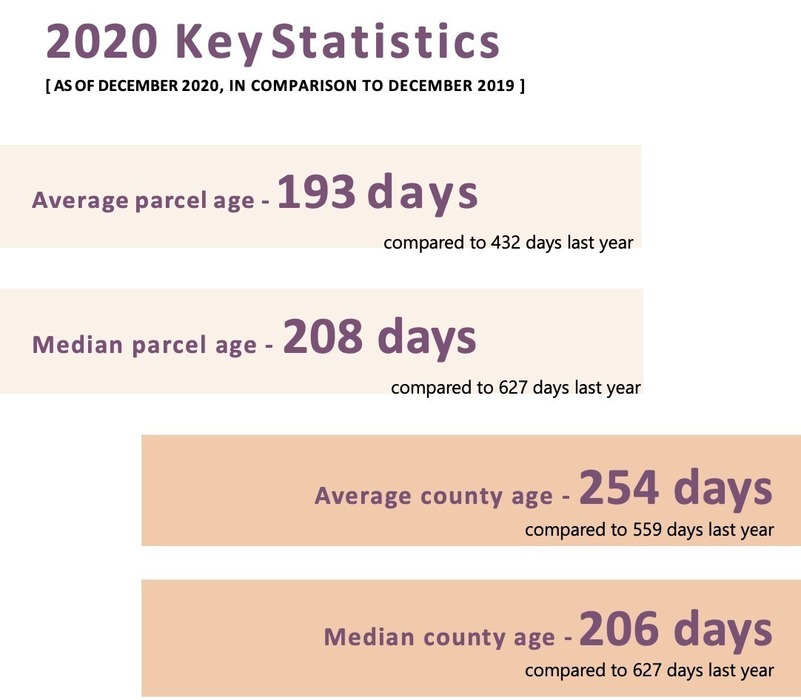
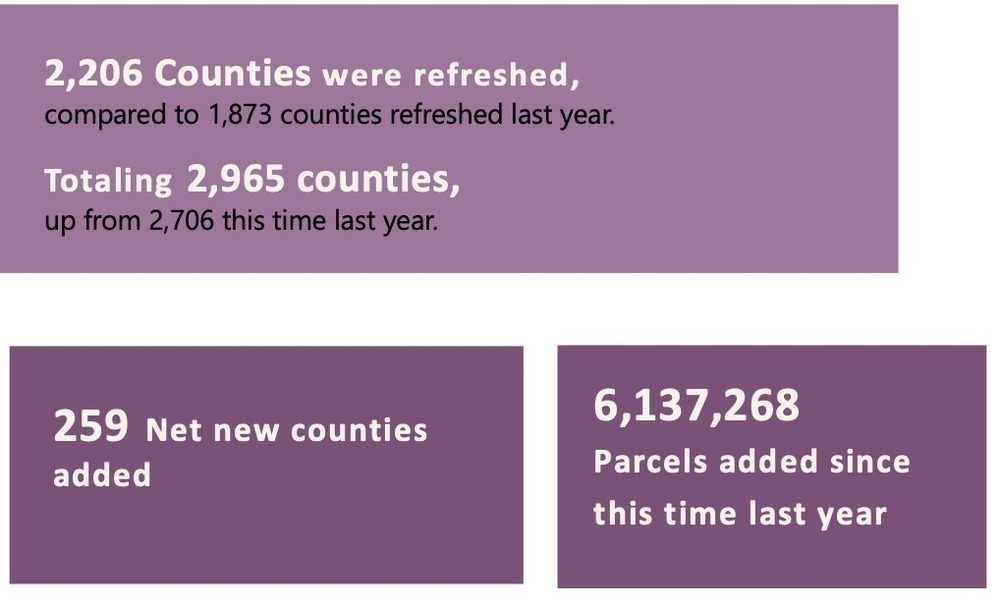
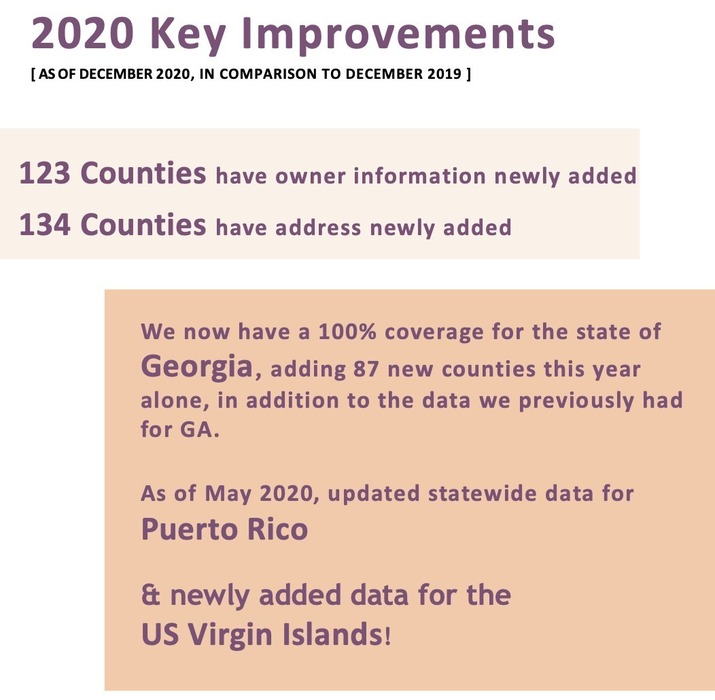
The report is a quick glimpse of an entire year's work focused on improving the quality, recency, coverage & completeness of our data.
We have come so far but we feel like we are only getting started.
Because we have even better things lined up for our product roadmap next year.
In the words of our CEO - Jerry Paffendorf:
"If you are a customer, thank you. And if you’re not yet, we’d like to hear from you."

While the report is absolutely amazing, nothing beats a good old fashioned banter between Loveland team members (Jerry Paffendorf & Sahana Murthy) discussing the year 2020, the challenges everyone in the world faced this year and the efforts we have made to improve our data & the exciting things we have in store on our 2021 roadmap.
So join them live today, Dec 16th at 3 PM ET / 12 PM PT on "The Talking Grid ", our video webinars.
Register here to save your spot - https://www.crowdcast.io/e/2020---wrap-up--eoy

That's a wrap on 2020 from the Loveland Team!
Oh we mean we won't be spamming you until next year. :)
But we are here and available if you need us or our parcel data the rest of the year and first thing next year as well. Just holler at parcels@landgrid.com.
On behalf of the entire Loveland Team, we wish you all a very happy, safe & healthy holidays!
Happy Mapping!
Team Loveland
http://landgrid.com
team@landgrid.com
313-649-LAND
By Sahana Murthy
on December 10, 2020
· Announcements
And just like that, we are in December! So much has happened this year, one email won’t be sufficient to summarize all of that.
To help with the summary, we are putting together an end of the year report on our parcel data, which we will share just before the holidays.
That said, this December update is super special, because it is purely focused on a special project that the Loveland team worked on and put together recently to wrap up the year.
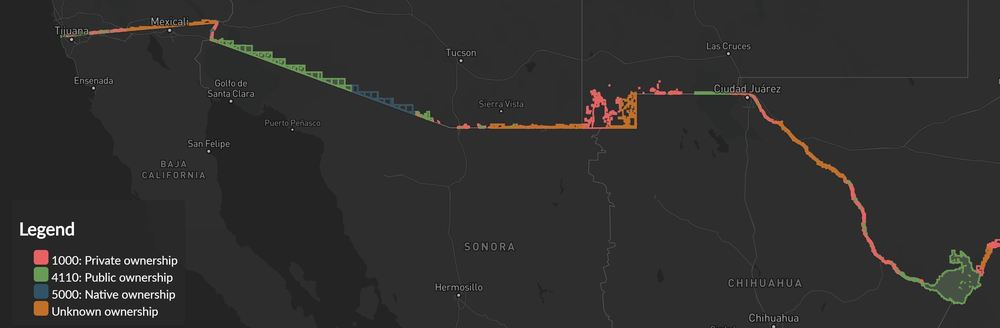
US-Mexico Border Map Project
Our team here at Loveland has been curious to take a deeper look at land along the US-Mexico border for a while, and this month we decided to make public an interactive map with an accompanying report!
The US-Mexico border is the subject of, shall we say, “vigorous debate” politically - but although much ink has been spilled, our team felt like there has been little said about the current state of the land which lies along its 2,000 miles. This is our attempt to look at the facts on the ground, by applying our parcel data to the task.


The US/Mexico border spans about 2,000 miles, four states and an incredibly diverse array of biomes ranging from major urban areas to swaths of desert. In recent years, the border (and immigration more broadly) has become a political flashpoint.
Here at Loveland, we realized that our nationwide parcel data was perfect to answer some basic questions that we hadn't heard much about in the media coverage.
Specifically:
1) Who actually owns border parcels where the wall is being proposed?
2) What does current land use look like along the border?
Our team dug deeper into the data and the above questions through this project.
Read the entire report here -

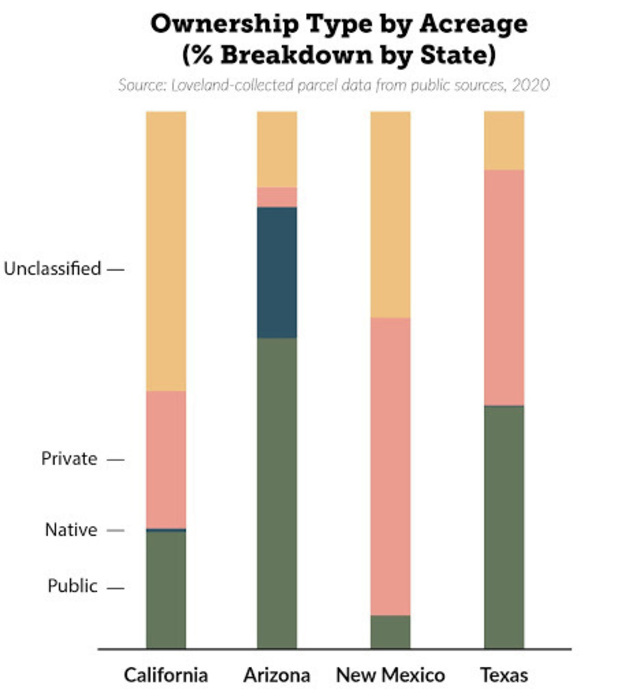
Along with improving the overall coverage, recency and quality of our parcel data, this year our data team has been working tirelessly in creating nationwide standardized land-use codes using the “Land Based Classification System” LBCS guidelines by APA.
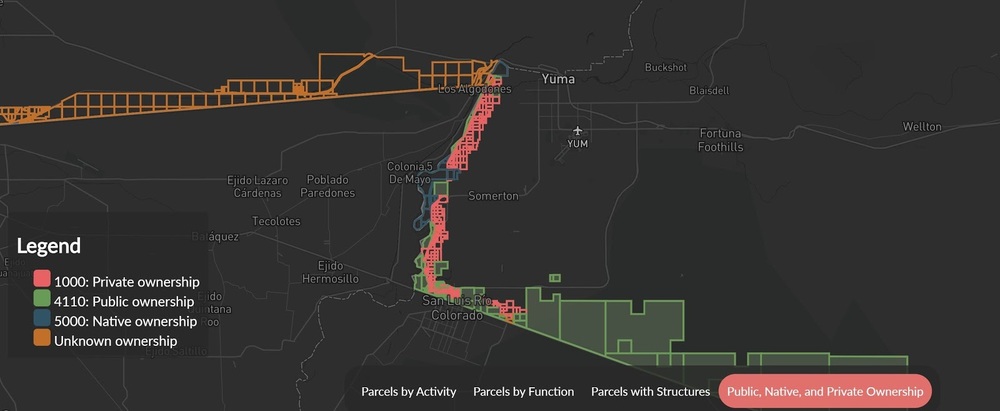
These same codes were applied to the land parcels along the border for a deeper analysis into the significance & ownership of these properties.
This is just one example of the kind of analyses that one can do with data as fundamental as parcel information, coupled with USPS vacancy & nationwide land-use code classification.
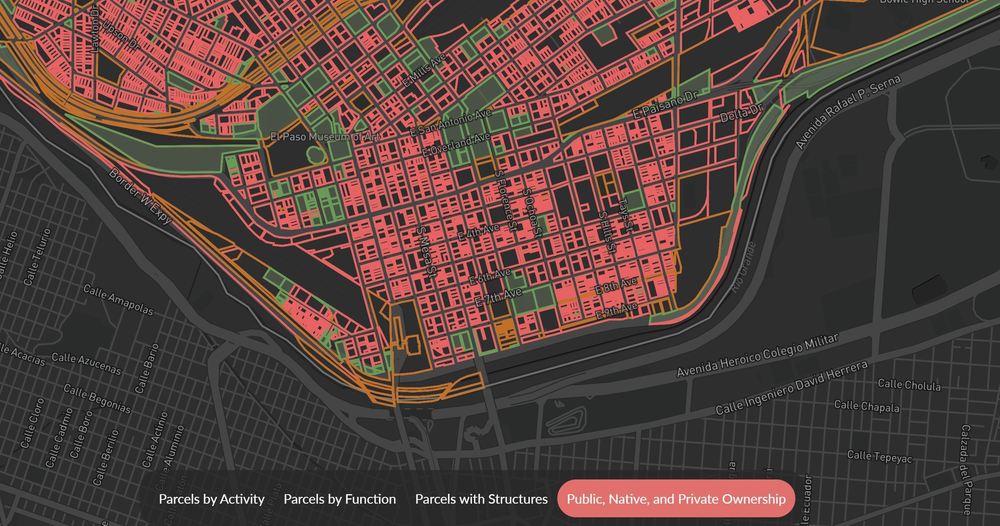
If this data is of interest to you or if you’d like to build cool interactive maps like the one shown above, please reach out to us at team@landgrid.com
Also, please don't hesitate to email us if you have any questions/feedback on the border map project.
That’s the December update for you.
Watch out for our EOY Parcel Data Report - key improvements & enhancements made to our data through the course of this year!
Until next time, have a wonderful rest of your December. As always, feel free to reach back to us at team@landgrid.com!
Happy Mapping!
Team Loveland
By Sahana Murthy
on December 9, 2020
· Announcements
Dear Friends of Loveland Parcel Data and landgrid.com,
A summary of updates in November of 2020 and the upcoming pipeline is below.
Key Data Stats:
- Average parcel age - 193 days, down from 207 last month
- Average county age - 254 days, up from 248 last month
- Added 175,978 parcels and refreshed 202 counties since last month.
Loveland Parcel Schema UPDATED - Cropland Data Layer attributes HAVE BEEN ADDED to the schema for this month's export. We also added in an additional mailing address related field, 'mail_country'. We will populate these attributes in Q1 of 2021.
USPS vacancy, residential indicators: Now updated monthly. Updated in November 2020, next update in December.
Coverage Report: Updated for this month and available here:
https://docs.google.com/spreadsheets/d/1q0PZB72nO8935EMGmsh3864VjEAMUE-pdHcPkoAiS5c/
For all full dataset customers, the updated data is available for download to bulk data clients in these formats: GeoPKG .gpkg (suggested), GeoJSON, Shapefile, and Postgres SQL files. In addition, this data has been updated on the landgrid.com website.
If your organization uses a custom export we are updating your data at the moment and if you don’t see the latest updates, please drop us a line.
A Data Dictionary for the Loveland Standard Schema is always available here:
https://docs.google.com/spreadsheets/d/14RcBKyiEGa7q-SR0rFnDHVcovb9uegPJ3sfb3WlNPc0/
A machine-readable version of this list is included in the `verse` table available in all the formats above as well as CSV format for use in spreadsheets. To find the latest updates in verse, sort by 'last_refresh' and use the 'filename_stem' column to identify the file.
Data refreshed or added from the county in November and live now:
( Asterisk * indicates newly added county)
--------------------------------------------------
Alabama - Bullock
Colorado - Adams, Alamosa, Arapahoe, Archuleta, Boulder, Broomfield, Clear Creek, Conejos, Costilla, Delta, Denver, Douglas, Eagle, El Paso, Fremont, Garfield, Gilpin, Grand, Gunnison, Huerfano, Jefferson, La Plata, Lake, Larimer, Las Animas, Logan, Mesa, Mineral, Moffat, Montezuma, Montrose, Morgan, Otero, Ouray, Park, Pitkin, Pueblo, Rio Blanco, Routt, Saguache, San Juan, San Miguel, Sedgwick, Summit, Weld, Yuma
Florida - Alachua, Baker, Bay, Bradford, Brevard, Broward, Calhoun, Charlotte, Citrus, Clay, Collier, Columbia, DeSoto, Dixie, Duval, Escambia, Flagler, Franklin, Gadsden, Gilchrist, Glades, Gulf, Hamilton, Hardee, Hendry, Hernando, Highlands, Hillsborough, Holmes, Indian River, Jackson, Jefferson, Lafayette, Lake, Lee, Leon, Levy, Liberty, Madison, Manatee, Marion, Martin, Miami-Dade, Monroe, Nassau, Okaloosa, Okeechobee, Orange, Osceola, Palm Beach, Pasco, Pinellas, Polk, Putnam, Santa Rosa, Sarasota, Seminole, St. Johns, St. Lucie, Sumter, Suwannee, Taylor, Union, Volusia, Wakulla, Walton, Washington
Georgia - McDuffie
Kansas - Johnson
Michigan - Bay, Clinton, Gladwin, Monroe, St. Joseph
Mississippi - Harrison
New Jersey - Cape May, Hudson
New York - Erie
Ohio - Allen, Ashland, Ashtabula, Athens, Auglaize, Belmont, Brown, Butler, Carroll, Champaign, Clark, Clermont, Clinton, Columbiana, Coshocton, Cuyahoga, Defiance, Delaware, Erie, Fairfield, Fayette, Franklin, Fulton, Gallia, Geauga, Greene, Guernsey, Hamilton, Hancock, Hardin, Harrison, Henry, Hocking, Holmes, Jefferson, Knox, Lake, Lawrence, Licking, Logan, Lorain, Madison, Mahoning, Marion, Medina, Mercer, Miami, Monroe, Montgomery, Morgan, Morrow, Muskingum, Ottawa, Paulding, Perry, Pike, Portage, Preble, Putnam, Richland, Sandusky, Scioto, Seneca, Shelby, Stark, Summit, Tuscarawas, Union, Van Wert, Warren, Wayne, Wood, Wyandot
Oregon - Douglass
Tennessee - Shelby
Virginia - Culpeper
In the current pipeline for updating in December 2020
--------------------------------------------------
South Carolina
In the pipeline for updating in January 2021
--------------------------------------------------
Alaska
Hawaii
Washington
Based on feedback and county challenges, pipeline planning is always subject to change. As always, please contact us if you have any questions about accessing or using the data, you find issues with any of our data, or you have any comments or questions about our data in specific areas or states. We also love to hear from you about which counties or regions you’d like to see us update next, as it helps inform our planning process.
Thank you for being a part of Loveland!
Happy Mapping!
Blake Girardot
blake@landgrid.com
Loveland Data Team
313-649-LAND
By Sahana Murthy
on November 19, 2020
· Announcements

We have some new exciting, end of the year offers for you - Ending Feb 2021!
You may have heard about our recently launched Self-Serve API & Tiles packages with monthly plans. If not, you can find them right here -
https://landgrid.com/parcel-api
https://landgrid.com/tiles
https://landgrid.com/combo
These work great for app & map developers who are looking at low to medium usage.
However, we understand that for many of your use-cases & requirements, a higher volume of usage & API requests are necessary.
Introducing Annual $12K API + Tiles Licenses:
We've always had flexible annual enterprise scale API & tiles packages but we are simplifying those further in a limited time - 3 month offer ending on 02/28/2021!
Below is the simplified pricing that we call the lucky 12 structure:

The Standard Bundle - Parcel API + Tiles (Vector & Rastor):
Annual license - $12K per year, with 120,000 parcel records + 12 M tiles per year.
- includes all of our standardized parcel attributes - https://support.landgrid.com/articles/schema
The Premium Bundle - Parcel API + Tiles (Vector & Rastor) :
Annual license - $18K per year, with 120,000 parcel records + 12 M tiles per year.
- includes our premium fields of USPS vacancy & residential indicators, building footprints sq footage and buildings count per parcel & all of Land-Based Classification System (LBCS) land-use fields.
Doesn't get better than this.
1 package that comes loaded with both tiles & parcel records for just $12,000 USD!!!
How to get started?
Email us at parcels@landgrid.com if you are interested to discuss this further.
Our bulk data & API prices may go up next year. So reach out today to try the API & lock in these prices.
"I might have a higher usage requirement than this" you say!
No worries. Reach out to us anyway at parcels@landgrid.com & we will get you a customizable package that better fits your needs. We have you covered!
Want bulk data & API - No problem there as well. Here's more information on both our bulk data & API offerings:
https://landgrid.com/parcels
https://landgrid.com/parcel-api
Don't wait up. Let us know what you need and we will get you a trial API token for testing right away. Or get a bulk data sample to test both or either - parcels@landgrid.com
Happy Mapping!
Loveland Technologies LLC