By Sahana Murthy
on May 5, 2020

Hope you are all doing well & safe.
The LOVELAND team is back with new updates & content for you.
Let’s jump right in then.
New & Updated Puerto Rico Data:
We are thrilled to announce that we now have the most recent, 2020 data available for Puerto Rico.
Well, we’ve had Puerto Rico data for some years -- and helped develop a plan and budget for a community-driven island-wide property survey that could still come to life one day if the time is right -- however, since 2016, we were unable to get updated, refreshed data for the island.
Not anymore! We recently received the most recent & updated data for all of Puerto Rico for 2020. That’s right - straight from a PR source.
We have added 38,635 additional parcels for Puerto Rico to our dataset: that brings us up to 1,523,802 parcels in total.
We also did some basic analysis on pre & post Hurricane Maria property data in Puerto Rico.
Read all about it in our latest blog - https://landgrid.com/blog/2020puertoricodata
If you're looking for the recently updated data for all of Puerto Rico, and we know many of you are since we get asked for this a lot, email us at parcels@landgrid.com.
It’s available for download and via API.
It is also available for self-serve download on the Landgrid parcel data store: https://landgrid.com/store/us/pr
The New Landgrid Enterprise - White Label Solution
Those of you who know us well, know that the Landgrid Enterprise has always been a custom solution, made to match your every need.
We are still the same custom solution but we have taken this one step further with the new Enterprise - White Label solution.
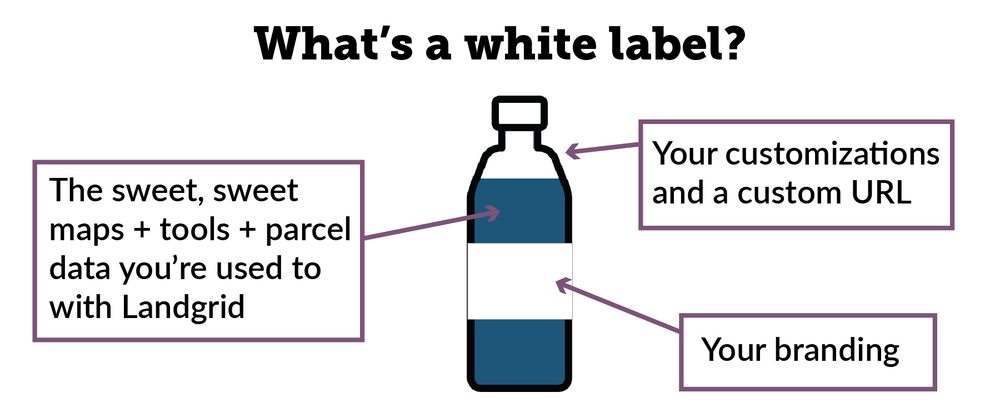
What do we mean by White Label you ask?
Well basically, with the white label solution, you get a fully customized and branded Landgrid mapping platform for your business, organization, or project that integrates with the software you already use.
Your Enterprise account will be powered by Landgrid and supported by the Loveland team, but it will be all about YOU: your brand, your logo, your data, your audience, and your goals, all hosted at your own domain name.
Not just the desktop version, but with this, we can white label & fully customize the Landgrid survey app as well.
So essentially, you get to make our Landgrid mapping platform your OWN!
Learn more about what you get with White Label here - https://landgrid.com/enterprise
Email us at enterprise@landgrid.com if you are interested to talk to us further.
If you are unsure about your use case or feel like your problem may not be solvable by our white label solution, email us anyway and we will work with you to find the right solution.
Meanwhile, you can check out some of the more common use cases that we have come across for which White Label would be perfect solution in this blog - https://landgrid.com/blog/white-labels-and-you
Safegraph COVID-19 Data Consortium:
We recently partnered with the amazing folks at Safegraph who put together an incredible data consortium bringing together data vendors, universities and researchers from all over the world to provide free data & enable COVID-19 research work.
We are so happy that just in a matter of a week, we have been able to provide our parcel data to multiple universities across the globe for their COVID-19 related research work.
If you or someone you know could benefit from this consortium, please let us know. You can also check it out here and apply to join the consortium - https://www.safegraph.com/covid-19-data-consortium
The Talking Grid - Landgrid Webcasts & Videos!
If you have been following us on social media, then you know that we have been busy building a library of podcast style webcasts and a series of helpful tutorial videos for you. Please subscribe to our Youtube channel to get notifications when we add new videos & webcasts.
Also, while you’re on our Youtube channel, don’t forget to check out the webinar we recently did with our partners at makepath here - https://www.youtube.com/watch?v=zgT_dYBzbHM&t=1s
And to all the GIS folks out there, we have an exciting webcast coming up with Mike Dolbow, the CEO of GeoHipster on May 8th, Friday at 1 PM ET.
Register here to join us live - https://www.crowdcast.io/e/chat-with-geohipsters

Well, that brings us to the end of this month’s update. We will soon put together a content newsletter for our Landgrid Pro community where we will share the helpful content & tutorials that we tirelessly create each month.
Until we meet again, please continue to be safe & well.
And...As always, please feel free to email us at team@landgrid.com for all data & platform related queries.
Happy Mapping!
By Sahana Murthy
on April 28, 2020
· Announcements
Big Announcement: Updated Puerto Rico data from 2020, now available at Landgrid.com.

We are thrilled to announce that we now have the most recent, 2020 data available for Puerto Rico.
Well, we’ve had Puerto Rico data for some years -- and helped develop a plan and budget for a community-driven island-wide property survey that could still come to life one day if the time is right -- however, since 2016, we were unable to get updated, refreshed data for the island.
Not anymore! We recently received the most recent & updated data for all of Puerto Rico for 2020. That’s right - straight from a PR source.
We have added 38,635 additional parcels for Puerto Rico to our dataset: that brings us up to 1,523,802 parcels in total.
If you're looking for the latest data for all of Puerto Rico, and we know many of you are since we get asked for this a lot, you can see it on the site at https://landgrid.com/store/us/pr.
If you need to export the raw data for use outside the site, email us at parcels@landgrid.com. It’s available for download and via API.
It is also available for self-serve download by the municipality on the Landgrid parcel data store: https://landgrid.com/store/us/pr
Loveland team members have made numerous visits to Puerto Rico and developed some good friendships on the island since Maria. We look forward to being back when the pandemic passes and it's safe to travel, and we hope to be helpful on more local projects in the future.
Below, find some notable improvements & updates between the data we had in 2016 and the data we have now:
|
Attribute/Column Name
|
Data from 2016
|
NEW PR Data (2020)
|
|
Ll_uuid (total number of unique parcels)
|
1,485,221
|
1,523,802
|
|
Parcel number
|
1,473,852
|
1,467,502
|
|
Mailing Address
|
Didn’t exist.
|
715,569 (Woo Hoo)
|
|
Parcel Address
|
1,263,592
|
1,301,223
|
|
Owner
|
737,183
|
1,301,821
|
|
Last Sale Date
|
Didn’t exist.
|
824,960
|
Hurricane Maria - Brief Analysis:
Our latest data update for PR also gave us some key insights into the possible impact of Hurricane Maria on the island’s property landscape - since Hurricane Maria hit Puerto Rico on Sept. 20, 2017, we have one dataset prior to the hurricane and one after.
Please bear in mind that the data we discuss below can NOT be directly a result or impact of Maria (although speculatively, they could very well be). It's also not possible for us to know the details of how the data is updated and maintained, and what might be missing that would add additional insight or otherwise impact the conclusions we draw below. We share some observations from the data here to help prompt further research and greater understanding of how things are changing over time.

Topo map, rainfall amounts, and Hurricane Maria’s path across Puerto Rico. Image from USGS. ^
Non-PR Ownership
A 'mailing address' is the place of record where an owner wants information (tax bills, other correspondence to property owners from the municipal government) to be sent. This makes it interesting data for analysis.

properties with non-Puerto Rico mailing addresses ^
- About 9% of Puerto Rico’s parcels for which we have owner mailing info list a non-PR mailing address currently. There are a further 1,600 properties that list a P.O. Box as the mailing address, for which location is difficult to determine.
It’s worth noting here that it’s not possible to break out how much of this ownership is former Puerto Rico residents who now live abroad, and how much represents external investment / non-Puerto Rican ownership.
Top 5 states with non-PR mailing addresses:
Florida: 9,162
New York: 8,756
New Jersey: 3,294
Texas: 2,617
Massachusetts: 1,448
- There were 4,064 purchases in the 2.5 years since Maria (ie from Maria until March 2020) that list a non-PR owner mailing address. For context, there were 3,081 out-of-state purchases in the 2.5 years prior, showing a 24% increase since Hurricane Maria.
Sale Data (Pre & Post Maria)
In an attempt to compare apples to apples as much as possible within this quick analysis, we took Hurricane Maria as the inflection point. Since we’re just about 2.5 years after Maria as of this writing, we took a corresponding 2.5 years prior to Maria (March 2015). All post- and pre- Maria data below, unless otherwise noted, are working with this 2.5 year span on either side.
- In terms of overall sales numbers, we see a 10% decrease in volume:
pre-Maria: 65,792
post-Maria: 59,324
- There was a corresponding decline in sales greater than $100,000:
pre-Maria: 21,446
post-Maria: 19,248
Sales pre-Maria over $100,000

Sales post-Maria over $100,000

- In general, median sales prices fell in Puerto Rico after the hurricane. One exception was the San Juan area, which saw a rise in prices. While one might think that this market activity in San Juan might be related to outside investment, we found nothing to indicate that that was the case: sales in that area were no more likely to have non-PR addresses than on the island as a whole (right around 10%).

There's much more to be learned from this dataset. If our software or the data itself can be helpful to your work, research, or advocacy in Puerto Rico please email us at team@landgrid.com.
- The Landgrid Team
By Nick
on April 21, 2020
· How-To
Hey all, this is Nick with Landgrid. I thought I’d do a quick blog post to talk a little bit about how excited we are to be able to offer white labeling services to our clients, and explain why we’re so stoked.
To Start:
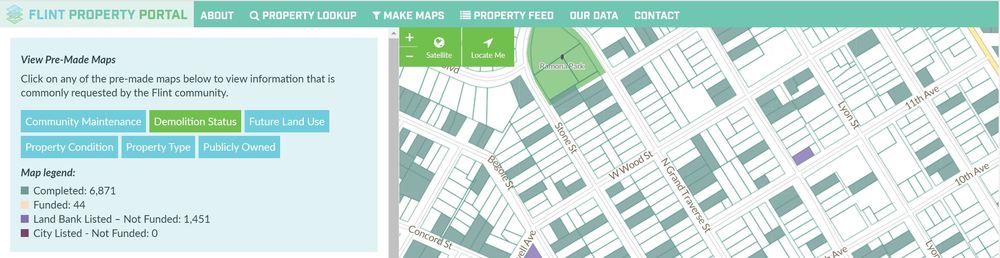
You already know that Loveland makes fantastic GIS software for visualizing and managing property information out of the box via our flagship platform, Landgrid.com. However, many of our most powerful projects have customized the look and feel of our software to the exact needs of a business, government, or community development organization (the Flint Property Portal is a great example).
In the past these projects were one-offs, meaning that the cool features that we made for one client we couldn’t easily replicate for others. What we have now for the first time is the ability to create these for pretty much any Enterprise customer who would like one, at scale.
What this means:
No matter what you’re using our platform and/or data for, we can customize a site that’ll make it all about you and your needs. We can change the look and feel of the site visually, as well as highlighting the information you need and removing anything you don’t. If you’ve ever thought “I wish I could do X thing with this data”, the time has come - now you can. I think you’ll agree, that’s pretty compelling.
So, what exactly is a white label? Glad you asked, and here’s a handy graphic to help explain.
As you can probably gather, white labeling is a broad concept and can apply to a lot of potential use cases, which is one of the reasons I think it’s so cool. For existing clients, white labeling can really supercharge the impact, utility, and visibility of their work with Landgrid; in addition, I also anticipate a whole swath of potential new customers for whom we suddenly become relevant and attractive.
Rather than continuing in generalities, I thought I’d lay out some specific examples of things that white labeling now allows us to get into via some friendly hypotheticals. If any of these spark an idea for you, your business, or someone you know, please check out our revamped Enterprise page and shoot me an email at enterprise@landgrid.com. As always, we’re more than happy to talk through the details as they relate to you specifically - we're a friendly bunch and love to take customers all the way from concept to finished product.
Real Estate
Scenario 1
You’re a real estate company with a portfolio of properties which you hold and/or manage. Your investors want to be able to quickly and easily see which properties are owned, status updates as they occur, and track potential future investments.
Solution
With a white labeled site, you can give your investors access to a private site at a URL of your choosing, with your companies’ branding, that color-codes properties by ownership or as potential leads. Property managers during their daily work or staff scoping out potential acquisitions use the Landgrid app to snap photos and make notes about properties, all of which shows up in real time on a customized field.
Scenario 2
You’re a realtor whose primary interest is in a specific region (or regions) of the country. You want the latest property transfer data as well as any other metrics you can get your hands on that will help you determine which properties to take on and how to market them.
Solution
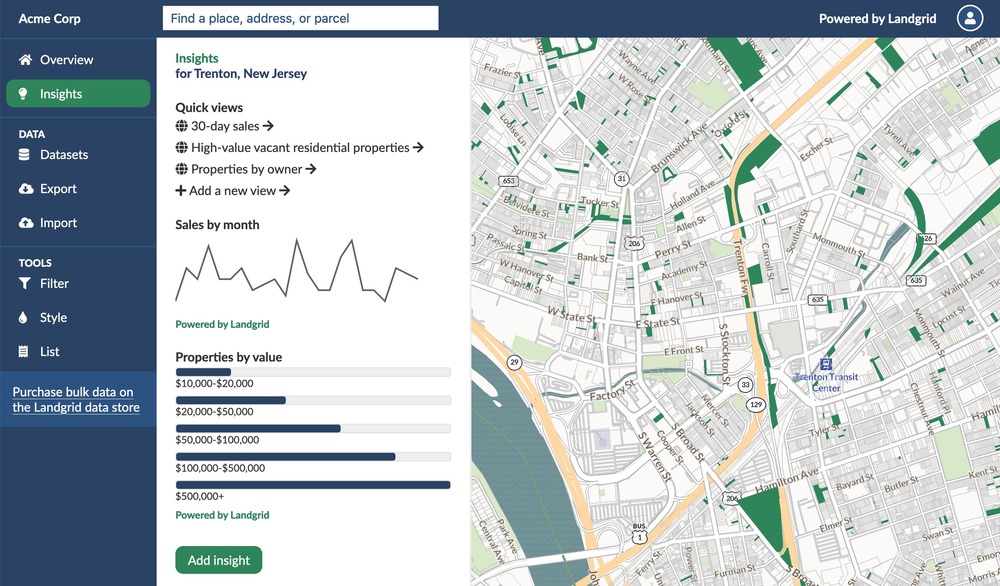
We’re bulking up our customizations so that you could set up a white label solution that pulls the metrics you’re interested in onto an Insights dashboard. You could see the number and sales value of properties sold in an area over time, bookmark properties you want to check out, and set up a data integration so that other sales data you have access to flows into your Landgrid account automatically.
Scenario 3
You’re a real estate investor, and you specialize in certain types of properties (commercial, vacant lots, residential rehab, etc). You need access to data that will give you an edge on finding these properties before your competitors.
Solution
Here, we’d set up some customizations on an Insights dashboard that could flag properties that fit your criteria as soon as they become available, in addition to some premade maps that would (for example) color code vacant commercial structures as yellow, vacant residential structures as blue, etc. Using this information, you could either go out and visit them in person with our survey app, or use it as a starting point to do outreach to the owners of those properties or other research.
Land Bank
Scenario 4
You’re a land bank, and you need a way to track properties from abandonment and vacancy, through acquisition, all the way to sale and transfer to new owners. You have hundreds of these properties, and it’s becoming a huge hassle to keep track of them all and make sure you have the most current data for any given property!
Solution
First of all, if you were using a database software to track properties, we could integrate with that - so that changes you make there get reflected onto our map. If you were doing it more, let’s say, “old school” via paper or a simple spreadsheet, we would be happy to consult, design and set up a new workflow for you that uses Landgrid primarily, making far more efficient use of you and your staff’s time going forward.
Nonprofit/Government
Scenario 5
You’re concerned with the increasing number of tax delinquent properties in your area, and you need segmented data, as well as a way of tracking outreach to residents.
Solution
We could set you up with a custom site that would have a handful of premade maps: one highlighting tax delinquent properties, one highlighting properties that have had outreach (what, when, and status), and a handful of other premade maps showing things like valuation and transfers so that you can anticipate which areas to pay special attention to in the coming months.
Scenario 6
You're a municipal government looking for a user-friendly way to publicly show the various investments and projects being undertaken by the city, because you value transparency and open data.
Solution
We’d set up for you an attractive public-facing interface as well as the training needed for staff to input data; premade maps for each area (streetscape improvements, paving projects, tree planting, etc) could be created. All data could be integrated with an existing Open Data portal if it exists for easy resident download, and/or we could host those downloads on the white labeled site itself.
Academic
Scenario 7
You’re digitizing hard-copy historic data (Census, building records, sales data, photos, etc) and you need a platform to input this data and tie it to the current parcel. You want the final product to be available to other researchers in the future.
Solution
Rather than recreate the wheel, you can use a site with Landgrid’s parcels as a georeferenced base on which to append your data. This site can be used by any number of staff while digitizing to submit records, and once the project is complete, you could work with Landgrid staff to visualize the data in whatever way feels most compelling. Project leaders could view productivity stats for staff working on the project, review digitized records, and flag any in need of further review.
Philanthropic
Scenario 8
You want a dashboard that can track investments you’ve made in a given city, or nationwide. In addition, you want to be able to easily see specific information that might inform data-driven decisions around equitable funding, and identify existing gaps in the funding you provide.
Solution
We can create an attractive interface that you can use to generate needed metrics for funders quickly ("we have funded 20 projects in ZIP code XYZ, 3 of which were arts & culture grants, and invested $3m") on a map which can be private or public.
By Sahana Murthy
on April 10, 2020
· Democratizing Data
 A summary of updates in March of 2020 and the upcoming pipeline is below.
April 2020 - Key Data Stats
Current average parcel age - 235, down from 257 last month
Current average county age - 310, down from 350 last month
Q1 2020 - Key Data Stats
Number of counties refreshed:
Q1 2020: 929 counties
Q1 2019: 610
Q2 2019: 454
Q3 2019: 292
Q4 2019: 722
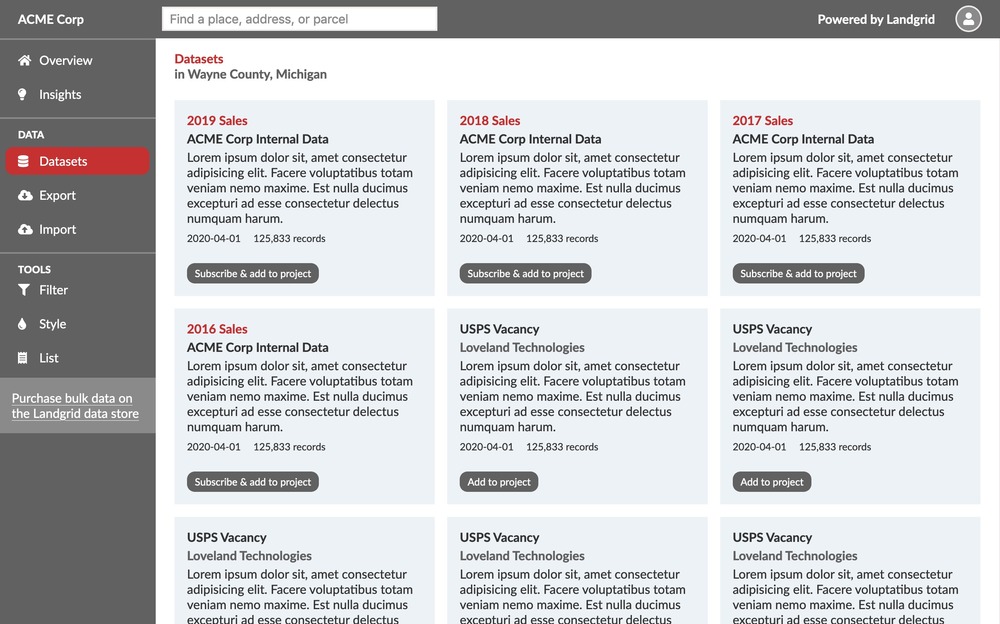
The Landgrid Data Store: We recently launched the data store, to allow our customers to quickly buy county data on the go. Most of you have our nationwide & statewide data with updates. However, if some of you are interested in individual county data or a handful of counties, you can now just go straight to the data store and buy data by the county, hasslefree and without delays.
https://landgrid.com/store
SPECIAL NOTE: USPS Vacancy, Residential indicators:
Updated in March 2020.
Coverage Report: Updated for this month and available here:
https://docs.google.com/spreadsheets/d/1q0PZB72nO8935EMGmsh3864VjEAMUE-pdHcPkoAiS5c/
For all full dataset customers, the updated data is available for download to bulk data clients in these formats: GeoPKG .gpkg (suggested), GeoJSON, Shapefile, and Postgres SQL files. In addition, this data has been updated on the landrid.com website.
If your organization uses a custom export we are updating your data at the moment and if you don’t see the latest updates, please drop us a line.
A Data Dictionary for the Loveland Standard Schema is always available here:
https://docs.google.com/spreadsheets/d/14RcBKyiEGa7q-SR0rFnDHVcovb9uegPJ3sfb3WlNPc0/
A machine-readable version of this list is included in the `verse` table available in all the formats above as well as CSV format for use in spreadsheets. To find the latest updates in verse, sort by 'last_refresh' and use the 'filename_stem' column to identify the file.
Data updated or added from the county in March and live now:
(bold indicates a newly added county)
--------------------------------------------------
California - San Diego
Hawaii - Hawaii, Honolulu, Kalawao, Kauai, Maui
Iowa - Statewide, all counties refreshed
Illinois - Ford
Kansas - Jewell, Sedgwick, Washington
Michigan - Wayne
Mississippi (7 newly added) - Adams, Alcorn, Amite, Attala, Benton, Bolivar, Calhoun, Carroll, Chickasaw, Choctaw, Claiborne, Clarke, Clay, Coahoma, Copiah, Covington, DeSoto, Forrest, Franklin, George, Greene, Grenada, Hancock, Harrison, Humphreys, Itawamba, Jackson, Jasper, Jefferson, Jefferson Davis, Jones, Kemper, Lafayette, Lamar, Lauderdale, Lawrence, Leake, Lee, Leflore, Lincoln, Lowndes, Madison, Marion, Marshall, Monroe, Montgomery, Neshoba, Newton, Noxubee, Oktibbeha, Panola, Pearl River, Perry, Pike, Pontotoc, Prentiss, Quitman, Rankin, Scott, Sharkey, Simpson, Smith, Stone, Tallahatchie, Tate, Tippah, Tishomingo, Union, Walthall, Warren, Washington, Wayne, Webster, Wilkinson, Winston, Yalobusha, Yazoo
New Mexico - Bernalillo, Chaves, Cibola, Colfax, Curry, De Baca, Doña Ana, Eddy, Grant, Harding, Hidalgo, Lea, Lincoln, Los Alamos, Luna, McKinley, Otero, Rio Arriba, Roosevelt, San Juan, Sandoval, Santa Fe, Sierra, Socorro, Taos, Torrance, Valencia
Pennsylvania (1 newly added) - Adams, Allegheny, Beaver, Bedford, Berks, Blair, Bradford, Bucks, Butler, Cambria, Carbon, Centre, Chester, Clearfield, Clinton, Columbia, Crawford, Cumberland, Dauphin, Delaware, Erie, Forest, Franklin, Fulton, Greene, Huntingdon, Juniata, Lackawanna, Lancaster, Lawrence, Lebanon, Lehigh, Luzerne, Lycoming, McKean, Mercer, Mifflin, Monroe, Montgomery, Montour, Northampton, Northumberland, Perry, Philadelphia, Pike, Potter, Schuylkill, Snyder, Sullivan, Susquehanna, Tioga, Union, Warren, Washington, Wayne, Westmoreland, Wyoming, York
Rhode Island - Bristol, Kent, Newport, Providence, Washington
Wisconsin - Milwaukee
In the current pipeline for updating in April 2020
--------------------------------------------------
Connecticut - Statewide
Kansas - Statewide
Montana - Statewide
Tennessee - Davidson County
Wyoming - Statewide
In the pipeline for updating in May
--------------------------------------------------
Texas - Statewide
Based on feedback and county challenges, pipeline planning is always subject to change. As always, please contact us if you have any questions about accessing or using the data, if you find issues with any of our data, or you have any comments or questions about our data in specific areas or states. We also love to hear from you about which counties or regions you’d like to see us update next, as it helps inform our planning process.
Thank you for being a part of Loveland!
Happy Mapping!