By Sahana Murthy
on March 26, 2020
· Democratizing Data
Reposted from Jerry Paffendorf's guest blog on makepath.com
https://makepath.com/parcel-data-landgrid/
----------------------------------------------------
Note about the author of this guest post: Jerry Paffendorf is co-founder and CEO of Loveland Technologies, makers of landgrid.com. Landgrid and makepath partner together on special projects.

“In the mid-19th century, when the cold tongue of land that is the Michigan peninsula was first being sliced up for development, the surveyors began to discover problems with their measurements, particularly during the winter. The lengths of metal chain they doggedly carried and laid out like giant rulers across the forests and swamps would shrink when the temperature dropped below zero.
“The resulting inconsistencies would only add up to a few inches a day, but over the vast distances of midwestern America the shrinking chains threatened to cause future disputes between landowners. Until a conscientious surveyor called William Burt came up with a solution: every frosty morning, he built a fire and warmed up his chain until it expanded back to exactly its original length.
“Such diligence, respect for figures, and slightly bloody-minded defiance of the elements is a very American combination. So to try to understand the country by describing how it was first surveyed and divided up, as this book does, is likely to be a fruitful enterprise.”
From a book review of Andro Linklater’s book, Measuring America, published by The Guardian
My company specializes in providing nationwide parcel data: the legal boundaries of properties along with addresses and information like ownership, land use, occupancy, buildings, and other data points that can be attached to parcels. It’s been a consuming pursuit as property boundaries underlie everything and form a natural ice cube tray for other data.
Parcels look like this, seen here with building footprints overlaid:

We are based in Detroit, Michigan and originally got into parcel data to help address challenges in the city. At its peak population in 1950, Detroit had about 2 million people and was America’s fourth largest city. Today it has about one-third of that, making its ratio of people to properties much different than the mid-20th century, with all of the attendant stresses to the tax base, maintenance, services, and occupancy you can imagine.
During Detroit’s bankruptcy in 2013 we were hired to assess the current land use, occupancy, and conditions of every single parcel of land in the city for a project called Motor City Mapping. The interactive map, photos, and dataset are archived at motorcitymapping.org.

For that project, 200 Detroiters used our software and mobile app to photograph and describe each property. In the process they identified more than 50,000 vacant buildings and tens of thousands of occupied homes that were at imminent risk of tax foreclosure, among other pressing challenges and opportunities in the landscape.
The data was combined with other datasets and kicked off a wave of innovative data and mapping projects in the city, and provided some much needed insight into the landgrid.
We wanted to be able to do something like that anywhere in the country, which meant we needed nationwide parcel data. Not having any other way to attain it, we set about collecting it from every single county ourselves.
That really sent us down the rabbit hole and got me reading about the history of how and why these parcels came to be in the first place. If you’re looking to read some fascinating history that you may not know much about — I certainly didn’t — do yourself a favor and google the US Public Land Survey or pick up Andro Linklater’s book, Measuring America: How the United States Was Shaped By the Greatest Land Sale in History.


(Image Credit - https://www.sfei.org/it/gis/map-interpretation/projections-and-survey-systems#sthash.96FRkw4y.dpbs)
Long story short, at Thomas Jefferson’s urging, and to create a spatial framework for a new nation of citizen farmers, starting in 1790 most of America outside the south and the original colonies was measured out and subdivided into square mile sections by people dragging metal chains through the woods, across rivers, over mountains, you name it. Every six by six squares was called a township. Townships snapped into counties, and counties snapped into states. The land was typically auctioned and then further subdivided over the years, decades, and centuries into the residential, commercial, industrial, agricultural, recreational, and wild parcels we know today.

You can stare at maps and see the straight lines of many states and counties, but it’s easy to overlook that they represent a nested fractal leading down parcels, which are the atomic unit of owned and managed space in society. Within that landgrid are so many accidents and arbitrary happenings that it makes you wonder how we might one day redraw it or return parts of it to nature. (PS if you like pictures like the one from Wikipedia above, check out the Instagram account, thejeffersongrid, which focuses on big square parcels.)

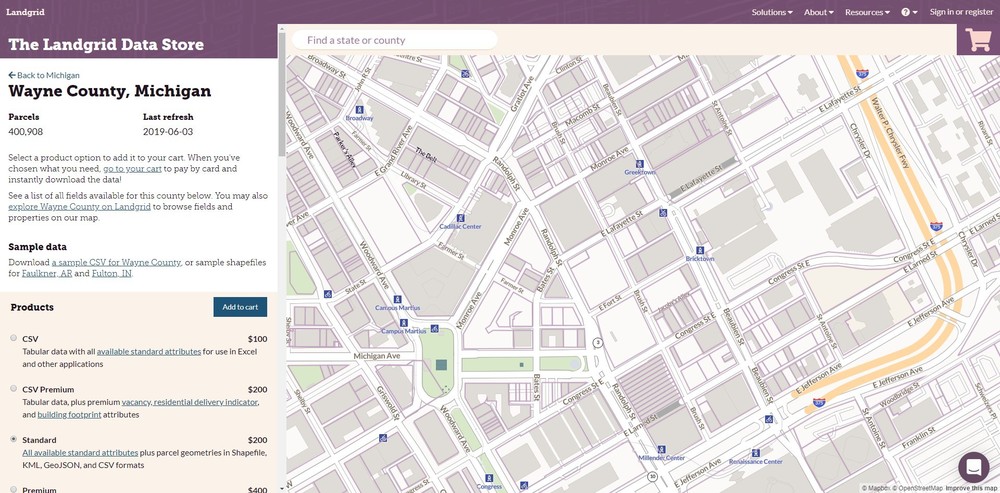
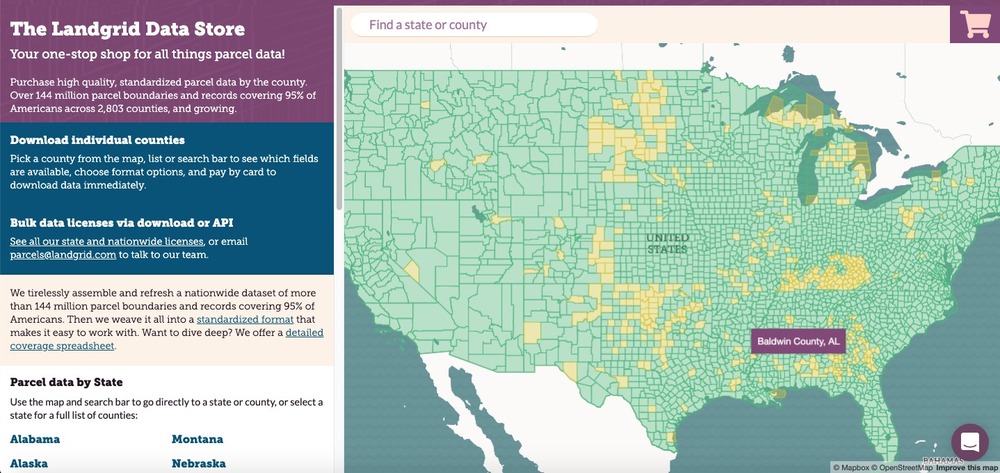
Our dataset currently consists of 144+ million parcels covering 95% of US residents. You can see a coverage map here, and you can see details about the data by clicking through to any county. Sometimes when the work is hard I think about that person warming their chain in a fire before dragging it through the woods another day, and it feels a little less hard to wrangle digital files with a LaCroix next to my keyboard.
We make the parcel data available for other people to use in their own research, apps, projects, and databases. Every day I wake up with a kaleidoscope of customers and partners and curious people in my inbox who span real estate, energy, insurance, agriculture, forestry, marketing, transportation, outdoor recreation, government, planning, and other industries that touch property, land, housing, and spatial analysis.
Sometimes people want to use the data for geocoding other datasets to a map. Sometimes they need to know who owns things. Sometimes they need to tell open land apart from land with buildings, or they need to identify occupied or vacant properties. Sometimes they need to do door-to-door outreach. Sometimes they use the data for business and sometimes for the joy of discovery.
Moving into the future, we’re really excited about the opportunities for combining parcel data with Machine Learning and aerial imagery. With the parcel boundaries as the picture frames, there are many new data fields and insights that will come from training software to identify the features within a parcel and turn that into structured data to give even greater insight into the grid and how we inhabit it.
All of this is what makes the work we do so exciting, and it’s why we value partnerships with data scientists like makepath who can take a massive, fundamental dataset like this and make new knowledge from it.
If we can assist you with parcel data, or if you just want to rap about how crazy the history is and what the future of parcels could look like, please reach out to me at jerry@landgrid.com. And please be safe in these unprecedented times!
By Jerry Paffendorf
on March 24, 2020
· Announcements
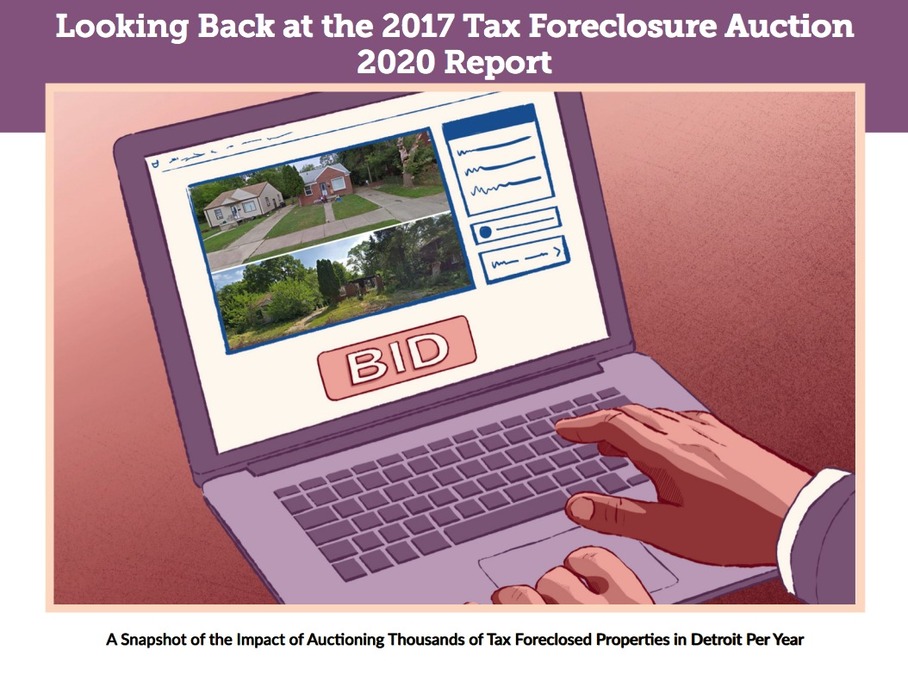
Jerry from the Loveland team here with a post about a new report written by Greg Markus with Detroit Action Commonwealth, made with the assistance of our software and analysis by our team, and supported by a grant from The Sociological Initiatives Foundation.
See the report here: Looking Back at the 2017 Tax Foreclosure Auction: 2020 Report.
Those of you who have followed our work over time know that our headquarters is in Detroit, MI and that the intense property and land-use challenges of Detroit are more than close to our hearts. Over the years we have been involved in many projects to improve our shared understanding of the city and to advocate for better outcomes for Detroiters, Detroit neighborhoods, and Detroit property. The research isn’t always pretty, because the challenges aren’t pretty.
Chief among these challenges is an incredibly encumbered and fragile Detroit property tax base combined with Michigan’s incredibly aggressive and punitive tax foreclosure law that seizes and auctions properties that owe as little as $1 from 3 years ago. This combination has led to approximately 150,000 Detroit properties being foreclosed and auctioned since 2002 (that’s more than ⅓ of properties in the city), including more than 50,000 occupied homes, with the majority of tax foreclosures occurring since Detroit’s bankruptcy in 2013, though programs and payment plans have been chipping away at the auction numbers in recent years.
This tax foreclosure policy is a beast that has proven largely impenetrable to holistic review and systematic change, with dire consequences for the city’s landgrid, neighborhoods, and the people directly affected. While the law’s original intent was to quickly return abandoned property to productive re-use, over time it became a force for separating people from their homes at scale and distributing property ownership to distant buyers.
As you’ll see on the first page of the report, tax foreclosure has not been impervious to the coronavirus, and Wayne County has announced a moratorium on tax foreclosures in 2020, which was announced on the same day we were finalizing the report.
We hope that while things are on pause that the findings of this report — which include a look at how many properties in the 2017 auction were occupied and are occupied now; how many were occupied by renters who were not responsible for taxes but faced uncertainty and eviction after the property was sold; how many out-of-town buyers purchased the properties; how the new owners are keeping up on the taxes, and the impact on current occupancy — contribute to giving policymakers pause and help lead to changes that turn this annual ritual from an exercise in self-harm to a more thoughtful and humane process that consciously achieves shared goals for a better, happier, healthier city.
If our team or our software can be helpful to you in doing similar kinds of property research, whatever the issue you are exploring may be, contact us at team@landgrid.com.
Be healthy, be safe, everybody!
By Raven Visser
on March 19, 2020
· How-To
While browsing Landgrid's data, you may have encountered fields like "lbcs_activity" and "lbcs_function", but their values are just 4-digit numbers. What exactly do those fields mean? Let's take a quick look!
The Land-Based Classification System (LBCS) is a method devised by the American Planning Association to describe how the land of an individual parcel is used. It encodes land use across five dimensions (activity, function, structure, site, and ownership). These codes are 4-digit numbers, with the first digit denoting the broadest category, and each successive digit describing the parcel in more detail.
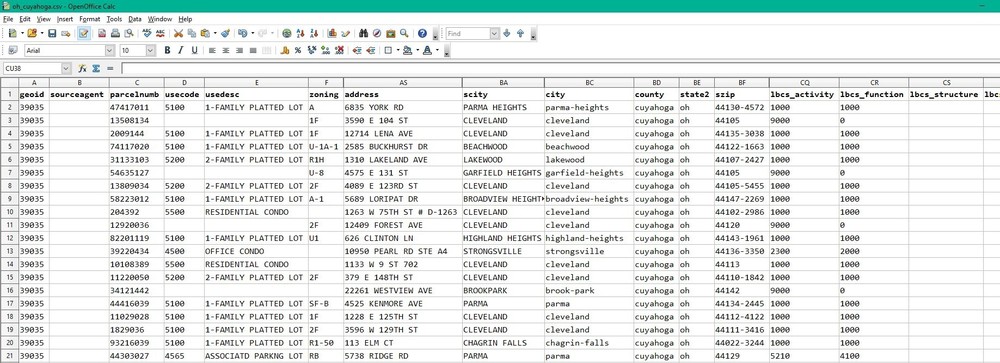
We focus primarily on the "lbcs_activity" and "lbcs_function" dimensions because they make the most sense at the parcel level. Activity describes the actual human activities that take place on the parcel, while function describes the broader economic or social use the parcel serves. For example, a parcel that is used as a parking lot for a school would have an "lbcs_activity" code of "5000" (for "Travel or movement activities"), but an "lbcs_function" code of "6000" (for "Education, public admin., health care, and institutional").
Most parcel data, however, does not use LBCS, and varies widely in how land use is classified (if that information is available at all). If there is any information pertaining to how a parcel is used, it usually takes the form of local zoning, land use, or tax assessors' codes. Because of this inconsistency, our LBCS classification work is done manually, county by county, matching each place's land use or zoning information to the nearest applicable LBCS code.
Currently, in Loveland's dataset of more than 144 million parcels, 54% of parcels have an LBCS code for function, and 45% of parcels have an LBCS code for activity. These percentages are increasing constantly as we add new places and fill in codes for existing ones. You can stay up to date on which places have LBCS data using the Landgrid coverage report.
We're working on implementing additional data fields to provide text description in addition to the LBCS codes. This will do away with the need to cross-reference the 4-digit codes in Landgrid's data with the APA website's master list of codes for each dimension. We hope to have these fields operational sometime in 2020.
The main reason we spend time implementing LBCS in our dataset is its universality. Local zoning, land use, or assessors' codes are still visible on parcels which have that data (usually in the "zoning", "zoning_description", "usecode", or "usedesc" fields, and sometimes in custom fields). But while there is variability from county to county what a zoning value of “101” or “R-1” is, an "lbcs_activity" value of "1000" always means "Residential activities".
This consistency means users of Landgrid's data and the mapping platform can perform queries to find trends across the dataset, or to count certain types of parcels. For instance, a regional business specializing in agricultural equipment could download the data for surrounding counties from the Landgrid data store, and query that data to find the number of parcels in each county with an "lbcs_activity" code in the range 8000-8999, for "natural resources-related activities".This could give a broad overview of places where agricultural activity is more prevalent and could help with focusing sales and marketing efforts where they are more likely to succeed.
Likewise, finding and mapping all the residential parcels in a city could help with understanding and tracking the spread of disease outbreaks like the current COVID-19 pandemic. If you are a local government or a fellow mapping and data company that could use parcel data to push forward your study, outreach efforts and research on COVID-19, or if you have questions about LBCS in general, please contact the Landgrid team at team@landgrid.com, or check out the parcel data FAQ.
Ray Visser
Team Loveland
By Sahana Murthy
on March 16, 2020
· Field Studies
As we're all aware, COVID-19 cases are on the rise. During these uncertain times, we all have to do our bit to contain the situation.
As a fully remote & distributed team, each one of our Lovelandians is working safely from their homes. However, we want to help out more.
We want to help & participate in the COVID research in any way possible. We have a nationwide, comprehensive dataset of 144 million parcels. While, parcel data may not be directly associated with medical research we do believe it can be useful for certain Coronavirus or census related research.
We want to offer our data to help with that. If you are a local government or a fellow mapping & data company that could use parcel data to push forward your study, outreach efforts & research on COVID-19, please contact the Landgrid team at team@landgrid.com.
Like I said, we all have to do our bit to help contain this situation - both at a personal & professional level.
Depending on the kind of analysis you are performing, our nationwide dataset of property shapes, addresses, ownership, buildings, and residential occupancy has immense utility in understanding populations and density at a much more granular level than a census tract or block.
If you are focusing on hyper local data for research, then please let us know. The Landgrid Data Store could be useful for local data assessments as well.
During this time of uncertainty, anxiety, and need, we’re all in on helping however we can.
Contact us at team@landgrid.com and we’ll figure out the best way to help you help others.