By Sahana Murthy
on July 7, 2020
· Democratizing Data
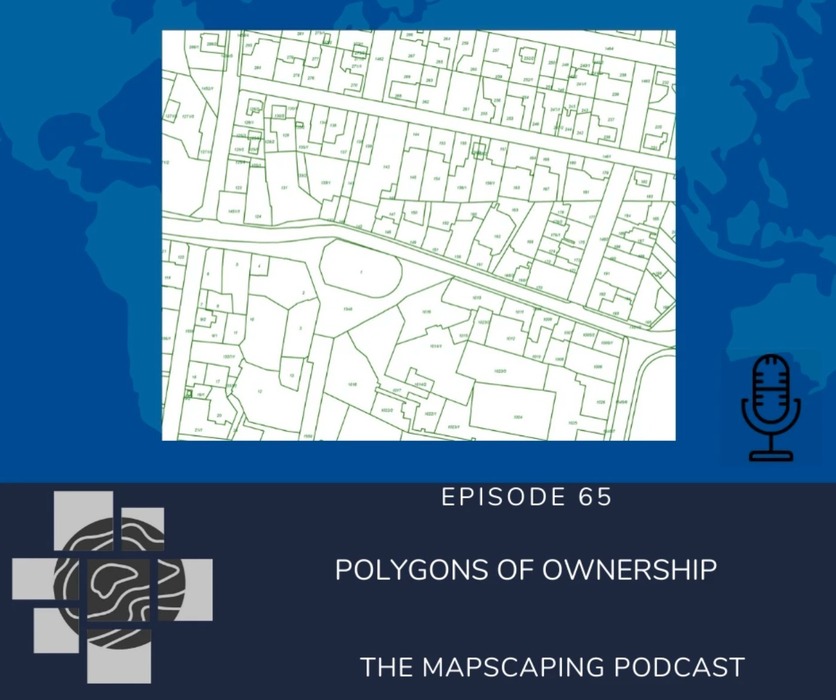
"The below is a cross-post of the Mapscaping blog on the podcast they did recently with our CEO - Jerry Paffendorf on land parcels, how our landgrid is divided & sub-divided & why parcel data is fundamental to decision making. The Mapscaping article is linked here.
You can also listen to the full podcasts here:
Android - https://buff.ly/2O3kuH5

Apple: https://buff.ly/2X6nMNW

Spotify: https://buff.ly/2X7Ym2k"

Jerry Paffendorf is the CEO and co-founder of Loveland Technologies. On their LandGrid.com, they map out the world for all to see how it is subdivided, owned, inhabited, and used in the form of land parcels.
WHAT IS PARCEL DATA?
It’s the subdivision of property boundaries that cover the US, numerous other countries, and ultimately, the Earth.
Property is surrounded by a legal space that the government defined and sectioned off to the owner with a street address for tax purposes. It’s a polygon, rectangle, or square space. A host of other information is connected to that parcel, such as when it was first subdivided, is there a structure on it, and does it have utility hookups? What are the permissions, zoning, and taxes owed on it?
Someone put a boundary of space around this area, defined it, subdivided the land, permitted ownership to it, and then allowed it for occupancy uses. It’s a giant crossword puzzle superimposed on the US and certain other parts of the world. This is what parcel data is.
HOW DO YOU EVEN COLLECT SUCH DATA?
In the US, the data is gathered and stored with county assessors, around 3,100 of them nationwide. The assessor is someone at the county level who is responsible for managing the taxation, ownership, and similar information. This is generated and rolled up from individual villages, towns, and cities. It’s usually stored and updated independently, for example, with varying column names and degrees of enthusiasm to share it or not. It’s public information, and as you can imagine, with these many parties doing things differently, sometimes it’s readily available, and sometimes it costs money to get it.
We take all that parcel data from every county and put it into a common schema, which is then organized, updated, and automated to the highest degree possible, and it becomes a seamless fabric. You can do analysis and work across different counties or states because it’s easy to digest.
WHAT DOES THE DATA LOOK LIKE?
The data is factual. It comes from the local government, and we add additional columns that are not typically available from the same authority, such as buildings data. Is there a building on this parcel? What is the size of the building? Occupancy data from the US Postal Service helps with determining if the building is occupied or not.
We also assign a nationwide land-use code to each parcel. In addition to local zoning, which is sometimes unavailable, this helps in determining what kind of land it is. Farming, urban, or commercial? These fields are continually evolving, and we keep them up to date.
Often, our partners and customers who use this data have property or location data but not a parcel. Now they can enrich their data with ownership particulars, legal boundaries, zoning, occupancy details, and addresses. Companies get more insights from these combined data sets.
WHAT OTHER DATA ARE PEOPLE COMBINING THIS WITH?
The possibility is vast.
Our parcel data is foundational; it’s basic, legal information—address, land use, ownership, and subdivision.
It’s rudimentary, but nevertheless very insightful. If you’re an insurance company and you have a list of current customers, you can now improve your risk modeling by including boundaries, ownership, or other fields in your model.
If you’re the creator of a hunting or outdoor recreation app, you’ll need to know if you have permission to access the land where you’re planning to go.
Real estate users combine our data and add the number of rooms or indicate a swimming pool that the property may have. They use this for sale prices and valuation models or for a history of ownership and mortgages.
Some people use it for geocoding location data onto a map or for machine learning models for changes in the temperature that affect sea-level rise for a particular area.
Recently, we joined a consortium of data companies that provide free data for doing research and response to COVID-19. It’s headed by a company, SafeGraph, that focuses on consumer points of interest, and provides information on consumer expenditure and foot traffic. The data comes from apps where people gave permission to show their location and is then used for COVID-19 research efforts.
Our parcel data can also be useful in simple cases, such as asking permission to create a garden on a vacant plot or even sending a letter to the owner to make them aware of something. All the pieces of land are owned and controlled by someone who is accountable for them and can be spoken to about something that’s happening there.
CAN THIS HELP WITH INCREASING THE ACCURACY OF GEO-REFERENCING?
Absolutely.
MapBox saw use in our parcel data. They help people place stuff accurately on a map based on addresses or latitude and longitude points. Parcel data that comes with addresses, as well as centroids in the middle of that polygon, can help position other kinds of data in the right place. In their case, they’re not interested in zoning, owners, taxes, or structures. They need an address and a physically bounded box that they can attach other data to and put it on the surface of the Earth more accurately and rapidly. We are happy to be a piece of the geocoding stack.
CAN YOU USE RASTER DATASETS AND IMAGERY?
Our data is factual. You can’t make it up. It’s not a case of someone looking at a house and claiming that a woman named Jennifer owns this. We work with facts from deeds to determine lot lines, the year the structure was built, or its assessed value. This information can be appended to that polygon, right to that parcel. To get to that point, you need to overlay it on top of different kinds of imagery or data that may not be structured similarly.
I’m really big on what the short-term possibilities are for taking that frame of a polygon, the frame of the parcel, and using it to crop super high-resolution imagery. Then you have a picture frame drawn around the surface of the Earth. What’s inside the picture frame? Grass, trees, buildings, cars, and activities. Now you can describe what’s in the frame to the system with human language.
Essentially there are 150 million land parcels that make up the US. That’s 150 million pictures with frames that need filling with data and imagery. Teach the software to the best you can what’s inside a frame, repeat a few thousand times, and you can run that over a much larger number of parcels.
We are only beginning to scratch the surface of this, and we can already see exciting work being done.
Those who deal with change detection on parcels, for example, need time-stamped aerial imagery from different dates. They want to see if there is a building or a tree in the way. Combining parcel data with imaging and other types of differently structured data is in the internal test phase, and we are creating the right partnerships.
We’ve got government facts which we’ve enhanced with other, privately assembled data and then added computer vision and some training. There is a lot you can do with this, even getting derivable insights about our planet.
Sometimes, all people need is a bit of parcel data to find the missing piece of what they’re working on that’s not as legible as they need it to be to understand properties and yards.
IS PARCEL DATA IMPORTANT FOR CLIMATE CHANGE MODELS?
It is, particularly, for the impacts of climate change or sea-level rise.
First Street Foundation does cutting edge modeling for climate change, sea-level rise, and the effects on coastal communities. Data scientists and geospatial experts might be looking at what’s the temperature in the atmosphere in a given area. How’s that correlating to ice melting? How’s that relating to the rise in the water? Where is the water going to spill over? How far above or below sea level?
Someone will then go and decide what all that means for actual people and property or municipal costs. If the water goes in this far, what will be the damage? How many properties will it cover? What are those properties? Houses, businesses, or institutional structures? What are the values of these buildings? Someone might have to decide on what will go into helping people to move if that’s necessary. Or incentivize residents to move to higher ground if that was deemed necessary by a local government.
For scientific, geological, or hydrological research, parcel data isn’t necessarily the set that you would grab first. But when you need to know the practical effects of an impact on a place, you’ll want our data at some point. Only then you’ll know how many people might be affected if this or that happens, and you might even need to get down to specifics, like ownership. This is how parcel data becomes relevant to climate change.
ISN’T THIS PARCEL DATA GRID SYSTEM OUTDATED?
It is. But don’t take my word for it. Andro Linklater wrote two books on the subject of land.
Owning the Earth is a historical overview of the land ownership regimes that different people, nations, and civilizations have applied. It’s an array from God owns everything, and the King/Queen/Pharaoh owns everything to our hybrid systems in the US, which is a more extreme version of private property.
Measuring Americais about how the land grid came into existence. Jefferson sent a group of surveyors around to subdivide space into square miles around 1790. They dragged 66-foot long metal chains through the woods, over prairies, mountains, and across rivers. They kept careful track of every square mile section, made notes on it, and gave it an identifier.
The idea was that every six by six square mile section could be set apart as a township and they set aside a square mile for public use of lands and education. These townships would snap together into counties and states. This was the thinking in the late 1700s.
There was this massive land, all that space. They wanted to create a coherent framework for it to be inhabited with residents. At the time, those plots were not developed organically, they were anomalous, so someone had to go and layout this grid.
Descriptions of these square mile parcels were brought to Washington DC, Philadelphia, New York, and auctioned off to the highest bidder. They were then further subdivided over time and became counties and states and reached a certain population. It’s the boundaries of that square mile survey that still subdivide and give boundaries to our city streets. Some parts of California and Texas did things differently. Nevertheless, from the Ohio-Pennsylvania border to the West and the North, you’ll find the imprint of the surveyors’ chain.
Since then, we’ve taken the grid for granted, and it’s more or less fixed and permanent. There isn’t much talk of changing or flexing it, andMeasure America never even considered Native Americans and indigenous people who were originally occupying the land. It was just laid out on top of a way of life that was here previously. Should the grid change and adapt to modern living patterns and the economy, allow for nature and conservation efforts?
Once you see the land grid, it gets you thinking. How could it be modified or used differently? What do you need to initiate change, and where do you even start? My guess is you start with group decisions and politics.
WHAT’S THE FUTURE LIKE FOR PARCEL DATA?
We started mapping parcels in Detroit, Michigan. At the time, there were many issues in the city, and the population was at its peak, three times the current number. There were a lot of vacant buildings and land to serve people better, people were losing their properties over not being able to pay over-assessed taxes, systematic racism and a diminished tax base were present with less than helpful neighbors.
One place that we saw where we could be useful is to illuminate the land grid. We built our business on figuring out whatshould exist, then how we can fund it, grow it, and provide reliable service.
In the future, someone should create a global repository for all subdivisions of space that humans are superimposed on, from countries down to individual buildings. The population of the planet has expanded hugely to around 8 billion, and we need to start managing resources and the quality of life by understanding how the Earth is owned, used, and occupied. What gets measured gets improved. It would take multiple lifetimes just to expand our data set and extend it to other places, figure out what issues people care about, and start to address them to make life better.
Of course, I can see issues with access and politics. Different views, cultures, power dynamics make this global vision a challenge. But it’s not entirely hopeless if you look at Wikipedia or OpenStreetMap. They are public, and people have access to them to understand things.
I’m thinking, in the future, what else can we add to something like them that would be similarly useful for people and life?
Everyone carries a smartphone around with them these days and – like it or not – you’re broadcasting yourself, and you’re trackable. Your location and activities are present on the grid. Someone is watching from space, and you’re in this mirror world situation. Governments and people will have to decide what works and what’s still comfortable, and I can see how this land grid is going to be part of that. It’s coming, and it’s either going to be built with a public sphere to it, or it will be quietly assembled by private actors and not very accessible. I’m trying to make moves that help our parcel data fit into this picture.
For now, my focus is on obtaining government facts, making the data easy to plug into, more accessible and affordable for people than it’s ever been before. Prioritizing people and projects and go by what feels right and fair.
We can help everyone: the curious resident, map makers, and organizations who need lots of stuff. Whatever you need, you’ll find something valuable using our free parcel viewer, GIS tools, or a land grid mobile app.
I, for one, was surprised to learn about Jefferson’s square mile survey back in the late 1700s. Did you go and look up the book on Amazon? I did. Do mirror worlds scare you, or you look forward to seeing some real-life sci-fi happening, and it got you thinking about that phone in your pocket? I’d love to hear your thoughts.
Be sure to subscribe to Mapscaping's podcast for weekly episodes that connect the geospatial community.
SUBSCRIBE HERE
MAPSCAPING
https://mapscaping.com/blogs/the-mapscaping-podcast/polygons-of-ownership
By Sahana Murthy
on July 2, 2020
· Democratizing Data
Dear Friends of Loveland Parcel Data and landgrid.com,
A lot of important information in this one!
A summary of updates in June of 2020 and the upcoming pipeline is below.
Key Data Stats:
- Total parcel age down by 5% from last month
- Average parcel age - 205 days, down from 217 last month
- Average county age - 239 days, down from 241 last month
- ~500K parcels added online since last month
Quarterly Stats:
- Q2 2020 - We refreshed 918 counties
- Q1 2020 - We refreshed 929 counties
Land Based Classification System (LBCS) Use Codes update: We have been steadily standardizing county use and zoning codes into the LBCS standardized use codes for land use activity and function and have made some big improvements over the past month. We now have over 70% of our parcels with an LBCS code.
Readable LBCS code descriptions - new columns: Use codes are pretty dry and hard to understand when just numbers, so we added the description for each code to every parcel. Please take a look at these columns if land use or use codes are important to you, feedback is welcome.
Shapefile Important Information: We have had some support questions around shapefiles and have made some improvements to help with the issues shapefiles present.
The shapefile format itself has a 'soft limit' of 2 gigabytes (GB) data. That means it is just a rule of the format "no data larger than 2GB" with no technical limit preventing more data being encoded as a shapefile. When we export large counties, our tools inform us the resulting shapefile is over that soft limit.
We can confirm that some software handles 2GB and larger shapefiles just fine (OSGeo tools), but some software will just silently ignore attribute data above the 2GB limit (ArcGIS). A sincere thank you to the Loveland client who did a lot of in depth research and testing on this and shared their results with all of us.
Starting this month we have made the following changes to help flag the counties who's data exceeds the 2GB soft limit. Please double check how you are handling these files.
- The filenames themselves will indicate the county generated the 2GB warning on export. '2GB_WARN' will be added to the file names so you can know just by checking the name.
- We also added a column to our 'verse' table, named 'shapefile_size_flag' so you can check against the 'verse' table to see if a place is one that needs a different format than shapefile or generate a list of places you need to pull the alternate format for.
USPS Vacancy, Residential indicators: Now updated monthly. Updated in June 2020, next update in July.
Coverage Report: Updated for this month and available here:
https://docs.google.com/spreadsheets/d/1q0PZB72nO8935EMGmsh3864VjEAMUE-pdHcPkoAiS5c/
For all full dataset customers, the updated data is available for download to bulk data clients in these formats: GeoPKG .gpkg (suggested), GeoJSON, Shapefile, and Postgres SQL files. In addition, this data has been updated on the landrid.com website.
If your organization uses a custom export we are updating your data at the moment and if you don’t see the latest updates, please drop us a line.
A Data Dictionary for the Loveland Standard Schema is always available here:
https://docs.google.com/spreadsheets/d/14RcBKyiEGa7q-SR0rFnDHVcovb9uegPJ3sfb3WlNPc0/
A machine-readable version of this list is included in the `verse` table available in all the formats above as well as CSV format for use in spreadsheets. To find the latest updates in verse, sort by 'last_refresh' and use the 'filename_stem' column to identify the file.
Data refreshed or added from the county in May and live now:
( Asterisk * indicates newly added county)
--------------------------------------------------
California - Contra Costa
Florida - Miami-Dade
Georgia - Douglas, Fayette, Henry
Indiana - Elkhart
Michigan - Berrien*, Hillsdale*
New Jersey - Atlantic, Bergen, Burlington, Camden, Cape May, Cumberland, Essex, Gloucester, Hudson, Hunterdon, Mercer, Middlesex, Monmouth, Morris, Ocean, Passaic, Salem, Somerset, Sussex, Union, Warren
Nevada - Carson City, Churchill, Clark, Douglas, Elko, Eureka, Humboldt, Lander, Lincoln, Lyon, Mineral, Nye, Pershing, Storey, Washoe, White Pine
New York - Steuben
Ohio - Lucas, Medina, Portage
Texas - Briscoe*, El Paso, Hale, Hall, Hamilton*, Hansford, Hardeman*, Hardin, Harris, Harrison, Hartley, Haskell, Hays, Hemphill*, Henderson, Hidalgo, Hill, Hockley*, Hood, Hopkins*, Houston, Howard, Hudspeth*, Hunt, Irion, Jack*, Jackson*, Jasper, Jeff Davis, Jefferson, Jim Hogg, Jim Wells, Johnson, Jones, Karnes, Kaufman, Kendall, Kenedy*, Kent, Kerr, Kimble, King, Kinney, Kleberg, Knox*, La Salle, Lamar, Lamb, Lampasas, Lavaca, Lee, Liberty, Limestone, Lipscomb*, Live Oak, Llano, Loving, Lubbock, Lynn, Madison, Marion, Martin, Mason, Matagorda, Maverick, McCulloch, McLennan, McMullen, Medina, Menard, Midland, Milam, Mills, Mitchell, Montague, Montgomery, Moore, Morris, Motley*, Nacogdoches*, Navarro, Newton, Nolan, Nueces, Oldham*, Orange, Palo Pinto*, Panola, Parker, Parmer, Pecos, Polk, Potter, Presidio, Rains, Randall, Reagan, Real, Red River, Reeves, Refugio, Roberts*, Robertson, Rockwall, Runnels*, Rusk, Sabine*, San Augustine, San Jacinto, San Patricio, San Saba, Schleicher, Scurry, Shackelford, Shelby, Sherman*, Smith, Somervell, Starr, Stephens*, Sterling, Stonewall, Sutton, Swisher, Tarrant, Taylor, Terrell, Terry, Throckmorton, Titus, Tom Green, Travis, Trinity, Tyler, Upshur, Upton, Uvalde, Val Verde, Van Zandt, Victoria, Walker, Waller, Ward*, Washington, Webb, Wharton, Wheeler, Wichita, Wilbarger*, Willacy, Williamson, Wilson, Winkler, Wise*, Wood, Yoakum, Young, Zapata, Zavala
Wisconsin - Milwaukee
In the current pipeline for updating in July 2020
--------------------------------------------------
We have a wider range of states, but fewer counties in each one than the past few months. These will let us add some missing rural counties and refresh some larger metro areas.
California - 3
Georgia - 2
Illinois - 2
Louisiana - 1
Massachusetts - Statewide
Michigan - 2
Missouri - 26 counties
New York - 4
Oklahoma - 1
Oregon - 2
Pennsylvania - 1
South Dakota - 6
In the pipeline for updating in August
--------------------------------------------------
Arizona
Wisconsin
Based on feedback and county challenges, pipeline planning is always subject to change. As always, please contact us if you have any questions about accessing or using the data, if you find issues with any of our data, or you have any comments or questions about our data in specific areas or states. We also love to hear from you about which counties or regions you’d like to see us update next, as it helps inform our planning process.
Thank you for being a part of Loveland!
Happy Mapping!
Blake Girardot
blake@landgrid.com
Loveland Data Team
313-649-LAND